Stock Market Outlook for August 17, 2023

A spike in the put-call ratio into the end of the day could be conducive to a short-term low in stocks ahead of the typically strong period surrounding the Labor Day holiday.
*** Stocks highlighted are for information purposes only and should not be considered as advice to purchase or to sell mentioned securities. As always, the use of technical and fundamental analysis is encouraged in order to fine tune entry and exit points to average seasonal trends.
Stocks Entering Period of Seasonal Strength Today:
Subscribers Click on the relevant link to view the full profile. Not a subscriber? Signup here.

Preformed Line Products Co. (NASD:PLPC) Seasonal Chart

Global X Lithium ETF (NYSE:LIT) Seasonal Chart

BMO MSCI Emerging Markets Index ETF (TSE:ZEM.TO) Seasonal Chart

First Asset Energy Giants Covered Call ETF (CAD Hedged) (TSE:NXF.TO) Seasonal Chart

Allison Transmission Holdings, Inc. (NYSE:ALSN) Seasonal Chart

Caesars Entertainment, Inc. (NASD:CZR) Seasonal Chart

Invesco Ltd. (NYSE:IVZ) Seasonal Chart

California Amplifier, Inc. (NASD:CAMP) Seasonal Chart
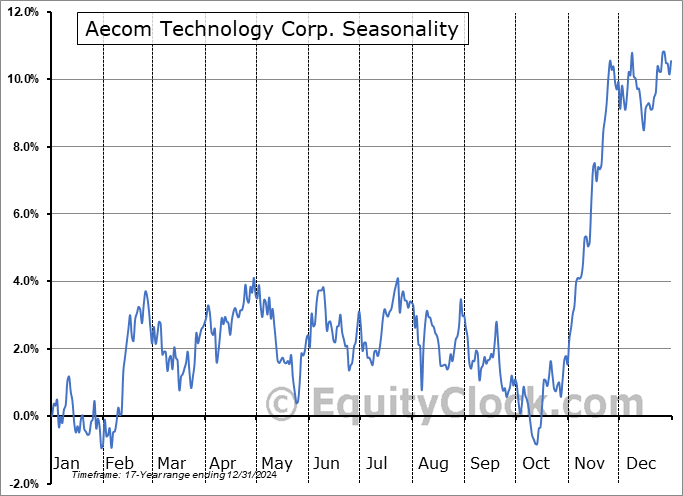
Aecom Technology Corp. (NYSE:ACM) Seasonal Chart
The Markets
Stocks continued to struggle on Wednesday as the period of normal volatility/weakness for markets progresses. The S&P 500 Index closed lower by three-quarters of one percent, closing firmly below its 50-day moving average for the first time since March. The loss of the important intermediate moving average as support opens the door to a test of the 100-day moving average at 4288, although levels all the way back to the June breakout point at 4200 are fair game as part of this period of seasonal weakness for stocks. The intermediate-term trend is still deemed to be that of higher-highs and higher-lows and that is not expected to change on this pullback, suggesting that looking for an entry point to the equity market ahead of the best six months of the year for stocks that starts in October will prove to be prudent. Momentum indicators are starting to relinquish their characteristics of a bullish trend by falling below their middle lines. Breaking up this period of broad weakness that spans the months of August and September, weakness through the middle of August typically sees a reprieve surrounding the Labour day holiday before the selloff returns in the back half of September, suggesting that we could be nearing the end of this initial declining phase before a bounce commences. However, with short-term resistance around the declining 20-day moving average, now at 4514, and tendencies, broadly, for stocks leaning negative into the end of the third quarter, we don’t see too much reason to be enticed by this pullback yet until we near the fall season. The unwind of the formerly beloved growth trade (eg. Technology) remains the driver of this pullback and the rise of treasury yields to the highest level in over 15 years certainly doesn’t help to get investors re-engaged in this former leadership group of the market. 
Today, in our Market Outlook to subscribers, we discuss the following:
- The move in the cost of borrowing to the highest level since 2007
- US Industrial Production
- Weekly Petroleum Status and the state of supply/demand
- Canada Consumer Price Index (CPI)
- The spike in the put-call ratio into Wednesday’s close
Subscribers can look for this report in their inbox or by clicking on the following link and logging in: Market Outlook for August 17
Not signed up yet? Subscribe now to receive full access to all of the research and analysis that we publish.
Sentiment on Wednesday, as gauged by the put-call ratio, ended overly bearish at 1.36.

Seasonal charts of companies reporting earnings today: 


 Seasonal Chart")

S&P 500 Index


TSE Composite


| Sponsored By... |

|


