Stock Market Outlook for August 8, 2023

During Pre-Election years, bonds perform particularly well between now and the start of October.
*** Stocks highlighted are for information purposes only and should not be considered as advice to purchase or to sell mentioned securities. As always, the use of technical and fundamental analysis is encouraged in order to fine tune entry and exit points to average seasonal trends.
Stocks Entering Period of Seasonal Strength Today:
Subscribers – Click on the relevant link to view the full profile. Not a subscriber? Signup here.

NetApp Inc. (NASD:NTAP) Seasonal Chart

United Airlines Holdings Inc. (NASD:UAL) Seasonal Chart

Woodward Governor Co. (NASD:WWD) Seasonal Chart

Norfolk Southern Corp. (NYSE:NSC) Seasonal Chart

Starbucks Corp. (NASD:SBUX) Seasonal Chart

Penske Automotive Group Inc (NYSE:PAG) Seasonal Chart

iShares Canadian Select Dividend Index ETF (TSE:XDV.TO) Seasonal Chart
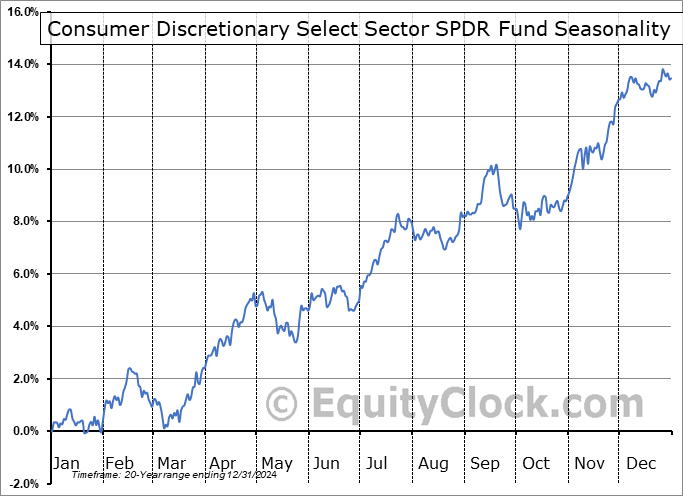
Consumer Discretionary Select Sector SPDR Fund (NYSE:XLY) Seasonal Chart

iShares U.S. Industrials ETF (NYSE:IYJ) Seasonal Chart

J&J Snack Foods Corp. (NASD:JJSF) Seasonal Chart

Reinsurance Group of America (NYSE:RGA) Seasonal Chart
Note: As a result of the Civic Holiday here in Canada on Monday, our next report will be released on Tuesday. Our weekly chart books will be updated as usual on Sunday.
The Markets
Stocks closed lower on Friday following the release of employment reports in Canada and the US that provided reason for concern pertaining to the health of the economy. The S&P 500 Index shed just over half of one percent, pushing further below short-term support at the rising 20-day moving average that was violated on Wednesday. Resistance can continue to be pegged at the downside open gap that was charted mid-week between 4450 and 4475, highlighting a cap to the short-term path that is now resulting in a pullback aligned with seasonal norms for this time of year. As has been highlighted in recent reports, levels down to the June breakout point at 4200 are fair game as part of this correction coinciding with the period of average volatility in the market, but the technicals suggest that this retracement warrants buying as part of the intermediate progression of higher-highs and higher-lows. Momentum indicators are pointing lower with the Relative Strength Index (RSI) starting to slip below its middle line. MACD triggered a sell signal on July 27th following a divergence against price that had materialized over the past month and prices have faltered ever since. Seasonally, this period of weakness continues, generally, through the end of September, with a holiday reprieve surrounding Labor Day. From what the technicals are portraying, this is a fair assessment of what we should see play out, barring some catalyst to the contrary, but this normal gyration should provide an ideal setup to be buyers of stocks again ahead of the best six months of the year for stocks that gets underway in October.

Today, in our Market Outlook to subscribers, we discuss the following:
- The VIX and Bonds
- Pre-election year tendencies for the bond and stock market over the next couple of months
- US Employment Situation
- Canada Labour Force Survey
Subscribers can look for this report in their inbox or by clicking on the following link and logging in: Market Outlook for August 8
Not signed up yet? Subscribe now to receive full access to all of the research and analysis that we publish.
Sentiment on Friday, as gauged by the put-call ratio, ended bearish at 1.03.

Seasonal charts of companies reporting earnings today:


S&P 500 Index


TSE Composite


| Sponsored By... |

|


