Stock Market Outlook for August 2, 2023

Consumer discretionary looking particularly vulnerable in the short-term as the growth trade that has flourished this year takes a pause.
*** Stocks highlighted are for information purposes only and should not be considered as advice to purchase or to sell mentioned securities. As always, the use of technical and fundamental analysis is encouraged in order to fine tune entry and exit points to average seasonal trends.
Stocks Entering Period of Seasonal Strength Today:
Subscribers – Click on the relevant link to view the full profile. Not a subscriber? Signup here.

Comstock Resources, Inc. (NYSE:CRK) Seasonal Chart

Everest Re Group, Ltd. (NYSE:RE) Seasonal Chart

Africa Oil Corp. (TSE:AOI.TO) Seasonal Chart

Barnes Group, Inc. (NYSE:B) Seasonal Chart

Kaman Corp. (NYSE:KAMN) Seasonal Chart

Tilly’s Inc. (NYSE:TLYS) Seasonal Chart
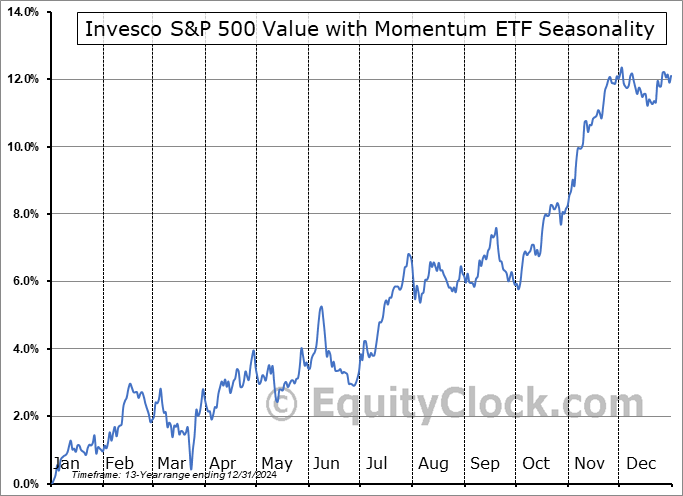
Invesco S&P 500 Value with Momentum ETF (AMEX:SPVM) Seasonal Chart

iShares S&P Global Industrials Index ETF (CAD-Hedged) (TSE:XGI.TO) Seasonal Chart
The Markets
Stocks pulled back slightly on Tuesday as rates and the dollar jumped amidst investor optimism pertaining to the strength of economic data. The S&P 500 Index slipped by just over a quarter of one percent, continuing to hold within the range of the bearish engulfing candlestick that was charted last week around resistance at 4600. Ongoing degradation in market momentum can be seen as MACD diverges from the direction of price amidst a renewed sell signal with respect to this technical indicator that was triggered in recent days. Support for the large-cap benchmark remains firm around the rising 20-day moving average, however, levels all the way back to the horizontal breakout point at 4200 are fair game as part of a near-term pullback coinciding with the period of normal volatility in the market during August and September. While the trajectory of the benchmark remains positive and we do not expect this to change on any near-term correction, the risk-reward to holding elevated equity exposure at present levels is not ideal, but using any weakness through the months ahead to buy remains prudent.

Today, in our Market Outlook to subscribers, we discuss the following:
- Waning momentum of consumer discretionary, while the consumer staples sector coils below resistance
- US Job Openings and Labor Turnover Survey (JOLTS)
- US Construction Spending
- The change in margin debt and credit balances in investor accounts
Subscribers can look for this report in their inbox or by clicking on the following link and logging in: Market Outlook for August 2
Not signed up yet? Subscribe now to receive full access to all of the research and analysis that we publish.
Sentiment on Tuesday, as gauged by the put-call ratio, ended bullish at 0.77.

Seasonal charts of companies reporting earnings today:


 Seasonal Chart")


 Seasonal Chart")


 Seasonal Chart")

S&P 500 Index


TSE Composite


| Sponsored By... |

|


