Stock Market Outlook for July 27, 2023

The Dow Jones Industrial Average just clocked in its 13th consecutive days of gains, the longest stretch since 1987.
*** Stocks highlighted are for information purposes only and should not be considered as advice to purchase or to sell mentioned securities. As always, the use of technical and fundamental analysis is encouraged in order to fine tune entry and exit points to average seasonal trends.
Stocks Entering Period of Seasonal Strength Today:
Subscribers – Click on the relevant link to view the full profile. Not a subscriber? Signup here.
United States 12 Month Natural Gas Fund (NYSE:UNL) Seasonal Chart
SPDR S&P Transportation ETF (NYSE:XTN) Seasonal Chart
Fortis, Inc. (TSE:FTS.TO) Seasonal Chart
Tupperware Brands Corp. (NYSE:TUP) Seasonal Chart
C.H. Robinson Worldwide, Inc. (NASD:CHRW) Seasonal Chart
The Markets
Stocks closed mixed on Wednesday as investors continue to react to earnings that, so far, are failing to provide the next upside catalyst that investors have been searching for to continue the rally. The S&P 500 Index was little changed, down by a mere two basis points (0.02%) and remaining just below the 52-week high charted in recent days around 4580. The daily candlesticks continue to show a reluctance of investors to accumulate further risk exposure at these heights and a point of horizontal resistance is being pegged around 4600. The intermediate path remains that of higher-highs and higher-lows, supported by rising moving averages, but a near-term check-back of these rising hurdles appears warranted, coinciding with the period of volatility for stocks in August and September. The direction of MACD continues to diverge from the path of price, an indication of near-term waning buying demand. The month of July is quickly coming to an end and, along with it, the positivity for stocks that is normal of this mid-year period. Seasonal tendencies are about to become much more difficult for the equity market through the months ahead as the period of normal volatility begins.
Today, in our Market Outlook to subscribers, we discuss the following:
- The win-streak on the Dow Jones Industrial Average and the upside target the chart pattern suggests for the ETF that tracks the benchmark
- Waning momentum in the technology sector
- Emerging Markets
- US Petroleum Status report
- US New Home Sales
Subscribers can look for this report in their inbox or by clicking on the following link and logging in: Market Outlook for July 27
Not signed up yet? Subscribe now to receive full access to all of the research and analysis that we publish.
Sentiment on Wednesday, as gauged by the put-call ratio, ended close to neutral at 0.95.
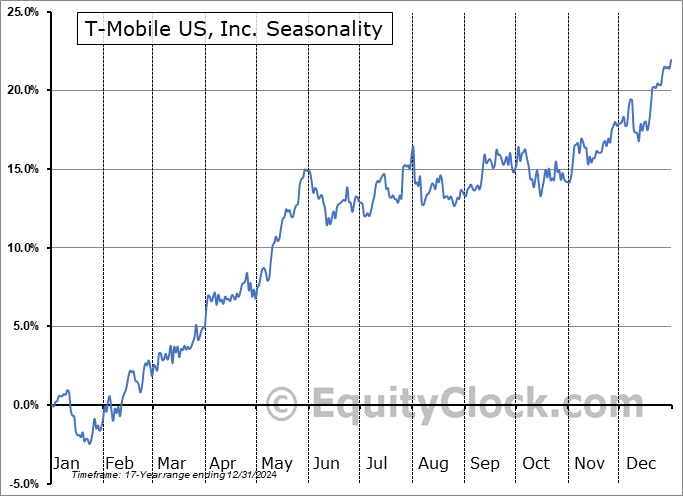
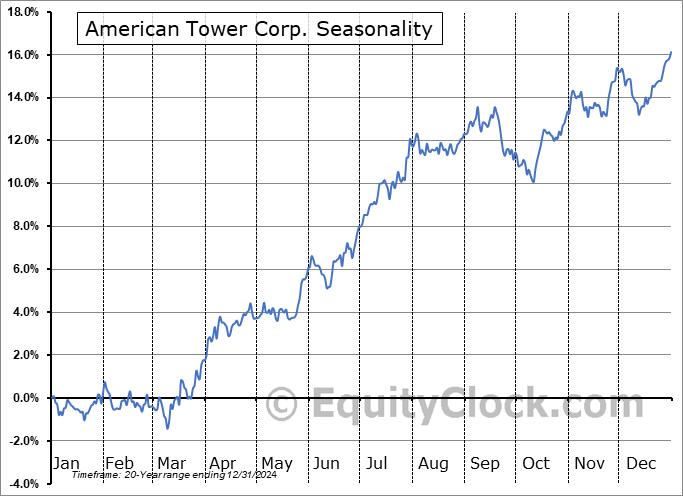
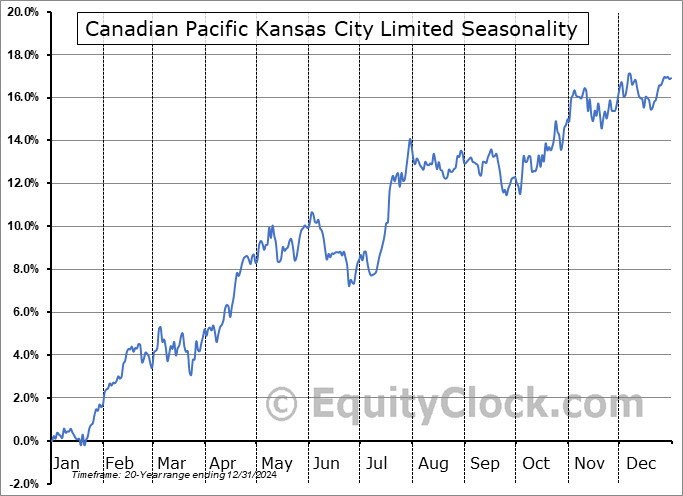
Seasonal charts of companies reporting earnings today:
S&P 500 Index
TSE Composite

| Sponsored By... |

|


