Stock Market Outlook for July 25, 2023

The market is finding new places to rotate to now that the growth trade that has flourished this year is showing waning upside momentum.
*** Stocks highlighted are for information purposes only and should not be considered as advice to purchase or to sell mentioned securities. As always, the use of technical and fundamental analysis is encouraged in order to fine tune entry and exit points to average seasonal trends.
Stocks Entering Period of Seasonal Strength Today:
Subscribers – Click on the relevant link to view the full profile. Not a subscriber? Signup here.

Hillenbrand Inc. (NYSE:HI) Seasonal Chart
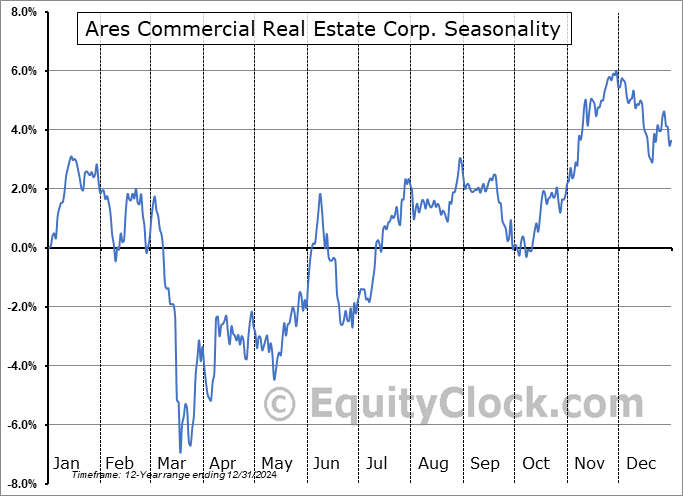
Ares Commercial Real Estate Corp. (NYSE:ACRE) Seasonal Chart

Carnival Plc. (NYSE:CUK) Seasonal Chart

National Grid Group (NYSE:NGG) Seasonal Chart

Koppers Holdings Inc. (NYSE:KOP) Seasonal Chart
The Markets
Stocks remained afloat on Monday as investors hold the tape steady ahead of a big week for earnings ahead. The S&P 500 Index advanced by four-tenths of one percent, holding just below the 52-week high charted last week at 4578. Evidence of waning upside momentum can be observed as momentum indicators roll over from overbought territory and MACD continues to diverge from price. Still, characteristics of a bullish trend remain with both RSI and MACD holding above their middle lines. Support remains firm at the rising 20-day moving average at 4462 and, without some catalyst presented in the days ahead, a check-back of this and/or the rising 50-day moving average at 4336 are fair game. Seasonally, beyond the month of July, the market enters a more volatile phase and holding excessive levels of risk while stocks are elevated well above levels of support is typically inappropriate, but using any retracement in price during the volatile timeframe is often prudent.

Today, in our Market Outlook to subscribers, we discuss the following:
- Short-term yields are no longer expanding faster than longer-term yields and what the investment implications may be
- Our weekly chart books update: Find out which areas of the market join our list of segments to Accumulate and the rotation that is taking place in the market
- The loss of momentum in the cryptocurrency market
Subscribers can look for this report in their inbox or by clicking on the following link and logging in: Market Outlook for July 25
Not signed up yet? Subscribe now to receive full access to all of the research and analysis that we publish.
Want to know which areas of the market to buy or sell? Our Weekly Chart Books have just been updated, providing a clear Accumulate, Avoid, or Neutral rating for currencies, cryptocurrencies, commodities, broad markets, and subsectors/industries of the market. Subscribers can login and click on the relevant links to access.
- Currencies
- Cryptocurrencies
- Commodities
- Major Benchmarks
- Sub-sectors / Industries
- ETFs: Bonds | Commodities | Equity Markets | Industries | Sectors
Subscribe now.
Sentiment on Monday, as gauged by the put-call ratio, ended bullish at 0.78.

Seasonal charts of companies reporting earnings today:


 Seasonal Chart")


S&P 500 Index


TSE Composite


| Sponsored By... |

|


