Stock Market Outlook for July 24, 2023

The average low to the Volatility Index (VIX) is today, resulting in an erratic trading pattern for stocks through the remainder of the third quarter.
*** Stocks highlighted are for information purposes only and should not be considered as advice to purchase or to sell mentioned securities. As always, the use of technical and fundamental analysis is encouraged in order to fine tune entry and exit points to average seasonal trends.
Stocks Entering Period of Seasonal Strength Today:
Subscribers – Click on the relevant link to view the full profile. Not a subscriber? Signup here.

Illinois Tool Works, Inc. (NYSE:ITW) Seasonal Chart

The Travelers Cos., Inc. (NYSE:TRV) Seasonal Chart
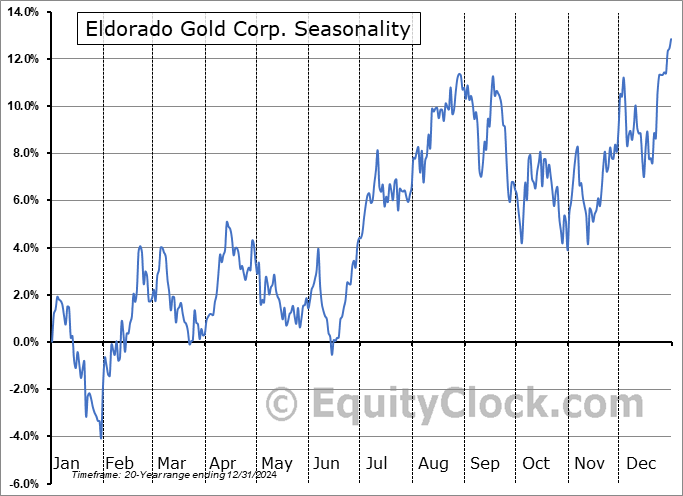
Eldorado Gold Corp. (TSE:ELD.TO) Seasonal Chart

iShares Core U.S. Aggregate Bond ETF (NYSE:AGG) Seasonal Chart

W. R. Berkley Corp. (NYSE:WRB) Seasonal Chart

Harmonic, Inc. (NASD:HLIT) Seasonal Chart

Norwegian Cruise Line Holdings Ltd. (NYSE:NCLH) Seasonal Chart

Slate Grocery REIT (TSE:SGR/UN.TO) Seasonal Chart

Caseys General Stores, Inc. (NASD:CASY) Seasonal Chart

Cal-Maine Foods, Inc. (NASD:CALM) Seasonal Chart
The Markets
Stocks ended mixed to close the week as investors positioned ahead of options expiration. The S&P 500 Index advanced by a mere three basis points (0.03%), making little progress to claw back some of the decline recorded in the previous session. Support remains solid at the rising 20-day moving average, now at 4452, and major moving averages continue to fan out in a bullish manner. Thursday’s decline attributed to the technology selloff pulled the benchmark out of overbought territory, according to the Relative Strength Index, but characteristics of a bullish trend remain with RSI and MACD holding firmly above their middle lines. The price action in the past two sessions provides hints that we may have seen the peak to this summer rally timeframe and we must be prepared for the onset of volatility through and beyond the heart of earnings season over the next couple of weeks. This year’s summer rally that ran from the 27th of June to the 17th of July has certainly been one for the record books, returning 4.48% for the S&P 500 Index, which is the 8th best summer rally performance over the past five decades. Looking at the seven instances prior to this one that produced similarly upbeat results, strength continued through the remainder of the year with returns averaging 7.59% between July 17th and December 31st.

Today, in our Market Outlook to subscribers, we discuss the following:
- Weekly look at the large-cap benchmark
- Seasonal low in the VIX and the period of volatility for the equity market
- The seasonal trade in bonds
- Canada Retail Sales and the strength of the consumer economy
- Consumer and business loan activity
Subscribers can look for this report in their inbox or by clicking on the following link and logging in: Market Outlook for July 24
Not signed up yet? Subscribe now to receive full access to all of the research and analysis that we publish.
Sentiment on Friday, as gauged by the put-call ratio, ended bullish at 0.89.

Seasonal charts of companies reporting earnings today:


S&P 500 Index


TSE Composite


| Sponsored By... |

|


