Stock Market Outlook for July 10, 2023

The population in Canada expanded at the fastest rate on record through the first half of the year, placing tremendous pressures on social services at a time when momentum in the labor market is slowing.
*** Stocks highlighted are for information purposes only and should not be considered as advice to purchase or to sell mentioned securities. As always, the use of technical and fundamental analysis is encouraged in order to fine tune entry and exit points to average seasonal trends.
Stocks Entering Period of Seasonal Strength Today:
Subscribers – Click on the relevant link to view the full profile. Not a subscriber? Signup here.

Goldman Sachs Group, Inc. (NYSE:GS) Seasonal Chart

Union Pacific Corp. (NYSE:UNP) Seasonal Chart

Kinross Gold Corp. (TSE:K.TO) Seasonal Chart

TFI International Inc. (TSE:TFII.TO) Seasonal Chart

Expedia, Inc (NASD:EXPE) Seasonal Chart

SPDR EURO STOXX 50 ETF (NYSE:FEZ) Seasonal Chart

Belo Sun Mining Corp. (TSE:BSX.TO) Seasonal Chart

Booz Allen Hamilton Holding Corp. (NYSE:BAH) Seasonal Chart
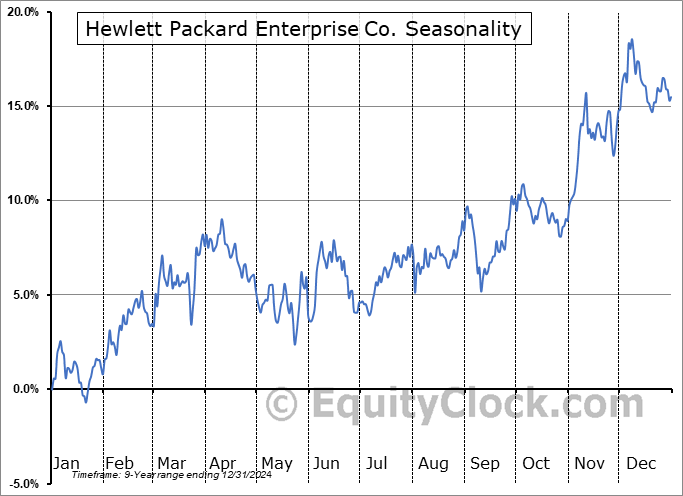
Hewlett Packard Enterprise Co. (NYSE:HPE) Seasonal Chart

Alimentation Couche-Tard, Inc. (TSE:ATD.TO) Seasonal Chart

Capital Power Corp. (TSE:CPX.TO) Seasonal Chart

SPDR Dow Jones Industrial Average ETF (NYSE:DIA) Seasonal Chart

Invesco Dividend Achievers ETF (NASD:PFM) Seasonal Chart

Global X U.S. Infrastructure Development ETF (AMEX:PAVE) Seasonal Chart
The Markets
Stocks wavered on Friday following the release of a weaker than expected read of employment in the US and the ongoing rise of interest rates. The S&P 500 Index closed lower by just less than three-tenths of one percent, weighed down by core-defensive sectors of staples, health care, utilities, and REITs. The large-cap benchmark remains supported by the rising 20-day moving average at 4382 and major moving averages continue to fan out in a bullish manner, providing a number of other points of reference below to catch the benchmark should it fall. But while the index is showing more characteristics of a bullish trend than a bearish one, evidence of short-term waning upside momentum that was derived following Thursday dip can continue to be picked out as investors express their reluctance to commit new funds following the parabolic rise in prices into the end of last quarter. A pullback to the recent breakout zone of 4200 is still fair game, but we continue to give the traditional summer rally period that spans the last week of June and the first few weeks of July the benefit of the doubt while remaining cognizant of the most volatile period for the market directly ahead spanning the months of August and September.

Today, in our Market Outlook to subscribers, we discuss the following:
- Weekly look at the large-cap benchmark
- US Employment Situation and the investment implications within
- Canada Labour Force Survey and the concerning trend of unemployment
- Record growth rate of Canadian population through the first half of the year
Subscribers can look for this report in their inbox or by clicking on the following link and logging in: Market Outlook for July 10
Not signed up yet? Subscribe now to receive full access to all of the research and analysis that we publish.
Sentiment on Friday, as gauged by the put-call ratio, ended bullish at 0.84.

Seasonal charts of companies reporting earnings today:


S&P 500 Index


TSE Composite


| Sponsored By... |

|


