Stock Market Outlook for July 7, 2023

The bond market and gold are testing some critical levels of support as their upside gaps from March get filled.
*** Stocks highlighted are for information purposes only and should not be considered as advice to purchase or to sell mentioned securities. As always, the use of technical and fundamental analysis is encouraged in order to fine tune entry and exit points to average seasonal trends.
Stocks Entering Period of Seasonal Strength Today:
Subscribers – Click on the relevant link to view the full profile. Not a subscriber? Signup here.

iShares MSCI Netherlands ETF (NYSE:EWN) Seasonal Chart
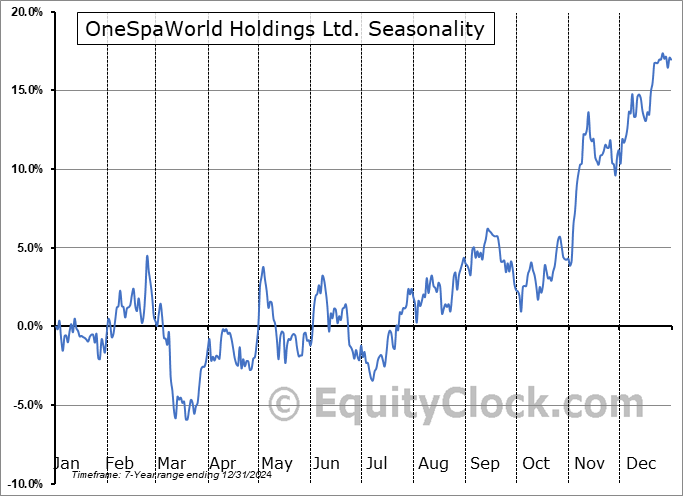
OneSpaWorld Holdings Ltd. (NASD:OSW) Seasonal Chart

Financial Select Sector SPDR Fund (NYSE:XLF) Seasonal Chart

Aberdeen Standard Physical Silver Shares ETF (NYSE:SIVR) Seasonal Chart

iShares MSCI Qatar Capped ETF (NASD:QAT) Seasonal Chart

iPath Bloomberg Cocoa Subindex Total Return ETN (NYSE:NIB) Seasonal Chart
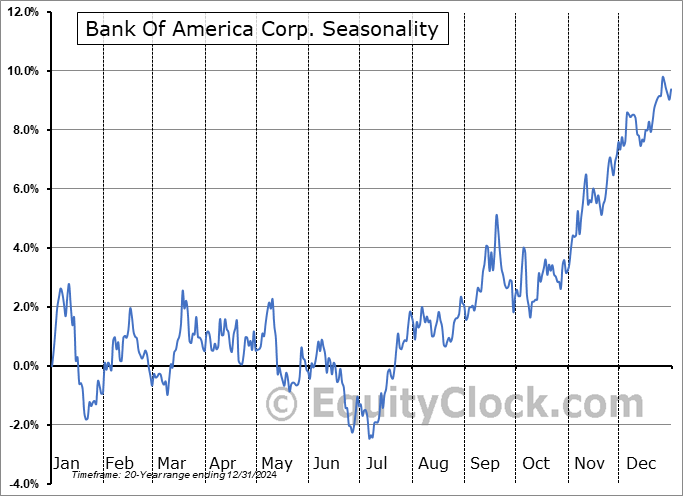
Bank Of America Corp. (NYSE:BAC) Seasonal Chart

Essent Group Ltd. (NYSE:ESNT) Seasonal Chart

Canadian Imperial Bank Of Commerce (NYSE:CM) Seasonal Chart
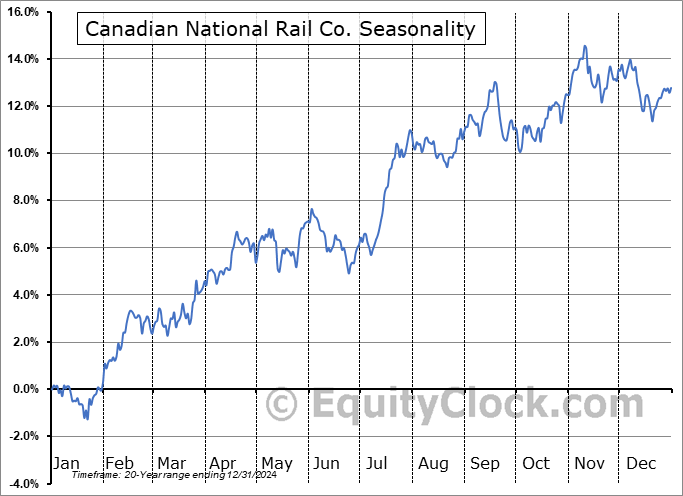
Canadian National Rail Co. (NYSE:CNI) Seasonal Chart

Nasdaq OMX Group Inc. (NASD:NDAQ) Seasonal Chart

CF Industries Holdings, Inc. (NYSE:CF) Seasonal Chart
The Markets
Stocks traded abruptly lower on Thursday following a sharp jump in interest rates as investors become concerned again of what the cost of borrowing may do to the economy. The S&P 500 Index closed lower by just less than eight-tenths of one percent, reaching back to rising variable support at the 20-day moving average at 4375. The snap-gap lower on the day charts an island reversal pattern, which is, essentially, a non-confirmation setup of last week’s breakout to the new 52-week high. Similarly failing to confirm the recent breakout to new multi-month highs last week are hints of negative divergences with respect to MACD and RSI. Keep in mind that both momentum indicators are remaining above their middle lines and support remains persistent at the 20-day moving average, keeping the bullish thesis for the summer rally timeframe alive, for now. Thursday’s price action merely warrants monitoring, for now, and if we see further downside follow-through in the days ahead, reason to cut short our mid-year optimism may be revealed. Seasonally, stocks tend to remain afloat between the last week of June and the first three weeks of July in what is known as the summer rally, but this mid-year strength gives way to the most volatile period of the year through the months of August and September. Any equity exposure that has been added in recent weeks should be perceived as a trade given this ominous period in the calendar ahead.

Today, in our Market Outlook to subscribers, we discuss the following:
- The critical level of support that the bond market is testing and the level that needs to be broken to violate the technical prong to our approach
- Gold similarly testing a critical hurdle ahead of the most volatile time of the year for stocks
- Job Openings and Labor Turnover Survey (JOLTS)
- Weekly Jobless Claims and the health of the labor market
- A preview of what to expect for the monthly non-farm payroll report
- The jump in demand for petroleum products into the Independence Day long weekend
Subscribers can look for this report in their inbox or by clicking on the following link and logging in: Market Outlook for July 7
Not signed up yet? Subscribe now to receive full access to all of the research and analysis that we publish.
Sentiment on Thursday, as gauged by the put-call ratio, ended close to neutral at 0.94.

Seasonal charts of companies reporting earnings today:

S&P 500 Index


TSE Composite


| Sponsored By... |

|


