Stock Market Outlook for June 13, 2023

Metal prices are in focus as we prepare for the period of seasonal strength that runs through the month of July.
*** Stocks highlighted are for information purposes only and should not be considered as advice to purchase or to sell mentioned securities. As always, the use of technical and fundamental analysis is encouraged in order to fine tune entry and exit points to average seasonal trends.
Stocks Entering Period of Seasonal Strength Today:
Subscribers – Click on the relevant link to view the full profile. Not a subscriber? Signup here.
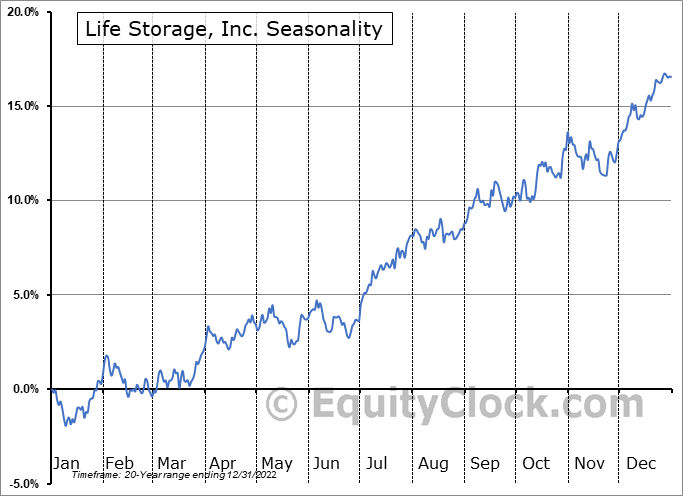
Life Storage, Inc. (NYSE:LSI) Seasonal Chart

Barrett Business Services, Inc. (NASD:BBSI) Seasonal Chart

Descartes Systems Group Inc. (NASD:DSGX) Seasonal Chart

iShares Global Comm Services ETF (NYSE:IXP) Seasonal Chart
The Markets
Stocks climbed to start the week as traders jockey for position around the FOMC meeting, the announcement from which will be made on Wednesday. The S&P 500 Index jumped by over nine-tenths of one percent, pushing through psychological resistance at 4300 and surpassing the last significant high charted in August of last year at 4325. The benchmark is on the verge of charting an overbought condition according to the Relative Strength Index (RSI) as the short-term parabolic trend becomes extended. While we are no longer seeing the benchmark correlate well with our speculated forecast direction for stocks this year, it continues to show the strong pace that is normal of pre-election years, a backdrop that tends to see funds continue to support the equity market into the middle of September.

Today, in our Market Outlook to subscribers, we discuss the following:
- The rare surge in the VIX during a strong session for stocks
- Weekly chart books update and our list of market segments to either Accumulate or Avoid
- High beta over low volatility
- The price action in the Cryptocurrency market
Subscribers can look for this report in their inbox or by clicking on the following link and logging in: Market Outlook for June 13
Not signed up yet? Subscribe now to receive full access to all of the research and analysis that we publish.
Want to know which areas of the market to buy or sell? Our Weekly Chart Books have just been updated, providing a clear Accumulate, Avoid, or Neutral rating for currencies, cryptocurrencies, commodities, broad markets, and subsectors/industries of the market. Subscribers can login and click on the relevant links to access.
- Currencies
- Cryptocurrencies
- Commodities
- Major Benchmarks
- Sub-sectors / Industries
- ETFs: Bonds | Commodities | Equity Markets | Industries | Sectors
Subscribe now.
You Asked and We Listened…
A subscriber suggested the addition of an economic performance dashboard, allowing for a quick and conclusive view of the macro fundamental framework of the economy through a seasonal lens. We are more than happy to accommodate and are excited to launch a dashboard for both the US and Canadian economies. These dashboards will be updated as new data-points are released, providing an up-to-date view of the fundamental drivers impacting the economy and the market. We will be linking to the dashboards in the days ahead, but, in the meantime, you can find them via the links in the report archive at https://charts.equityclock.com/ or through the URLs below:
Sentiment on Monday, as gauged by the put-call ratio, ended bullish at 0.87.

Seasonal charts of companies reporting earnings today:


S&P 500 Index


TSE Composite


| Sponsored By... |

|


