Stock Market Outlook for May 24, 2023

Consumer Discretionary ETF breaks out, while the Consumer Staples ETF breaks down.
*** Stocks highlighted are for information purposes only and should not be considered as advice to purchase or to sell mentioned securities. As always, the use of technical and fundamental analysis is encouraged in order to fine tune entry and exit points to average seasonal trends.
Stocks Entering Period of Seasonal Strength Today:
Subscribers – Click on the relevant link to view the full profile. Not a subscriber? Signup here.

TDH Holdings, Inc. (NASD:PETZ) Seasonal Chart

Carvana Co. (NYSE:CVNA) Seasonal Chart

SPDR S&P 500 Fossil Fuel Free ETF (AMEX:SPYX) Seasonal Chart

Ooma, Inc. (NYSE:OOMA) Seasonal Chart

BMO NASDAQ 100 Equity Hedged to CAD Index ETF (TSE:ZQQ.TO) Seasonal Chart

Boot Barn Holdings Inc. (NYSE:BOOT) Seasonal Chart

RH (NYSE:RH) Seasonal Chart

Nathans Famous, Inc. (NASD:NATH) Seasonal Chart

Dynavax Technologies Corp. (NASD:DVAX) Seasonal Chart
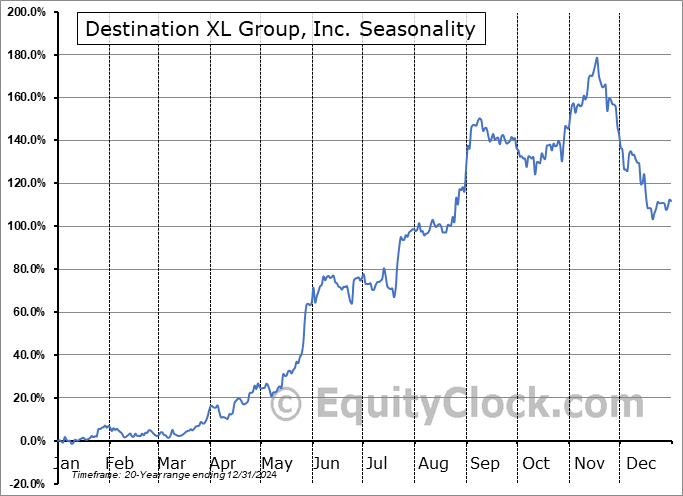
Destination XL Group, Inc. (NASD:DXLG) Seasonal Chart

Lithia Motors, Inc. (NYSE:LAD) Seasonal Chart
The Markets
Stocks closed firmly lower on Tuesday as investors scrutinize the progress of debt ceiling negotiations between the Democrats and Republicans. The S&P 500 Index shed 1.12%, alleviating much of last week’s strength attributed to optimism pertaining to the same. The market is clearly just trading from one headline to the next, not really finding a basis in anything sustainable that spans beyond something more than just a day. The benchmark remains capped by the range of resistance between 4100 and 4200, while the congestion of major moving averages, now between 3980 and 4080, provide the zone of support below. While a MACD buy signal was triggered last week, momentum indicators have yet to show that they have definitively turned higher after the recent peak charted in April. A catalyst is still viewed as necessary to fuel a breakout, whether to the upside or the downside, but, with the ongoing degradation in economic fundamentals, the risk remains greater to the downside. Seasonally, stocks have historically shown a positive bias during this week heading into the Memorial Day holiday, but with the upside gyration in stocks realized last week, we may have to acknowledge that this holiday induced fuel has been spent before the fireworks are lit in the days ahead. The next pronounced move in the market, outside of any short-term headline induced reaction, is likely to coincide with the mean-reversion into the end of the quarter and the first half of the year, a phenomenon that is likely to be pronounced given the disconnect in the performance between asset classes this year.

Today, in our Market Outlook to subscribers, we discuss the following:
- Weekly MACD Buy signal on the chart of the US Dollar Index and what it means for stocks
- Our weekly chart books update: Find out which segments of the market have joined our list of areas to Avoid
- Retail industry stocks
- US New Home Sales and the stocks of the builders
Subscribers can look for this report in their inbox or by clicking on the following link and logging in: Market Outlook for May 24
Not signed up yet? Subscribe now to receive full access to all of the research and analysis that we publish.
Want to know which areas of the market to buy or sell? Our Weekly Chart Books have just been updated, providing a clear Accumulate, Avoid, or Neutral rating for currencies, cryptocurrencies, commodities, broad markets, and subsectors/industries of the market. Subscribers can login and click on the relevant links to access.
- Currencies
- Cryptocurrencies
- Commodities
- Major Benchmarks
- Sub-sectors / Industries
- ETFs: Bonds | Commodities | Equity Markets | Industries | Sectors
Subscribe now.
Sentiment on Tuesday, as gauged by the put-call ratio, ended close to neutral at 0.94.

Seasonal charts of companies reporting earnings today:


 Seasonal Chart")


 Seasonal Chart")


S&P 500 Index


TSE Composite


| Sponsored By... |

|


