Stock Market Outlook for May 15, 2023

Difficult to be bullish of stocks if the US Dollar is no longer declining.
*** Stocks highlighted are for information purposes only and should not be considered as advice to purchase or to sell mentioned securities. As always, the use of technical and fundamental analysis is encouraged in order to fine tune entry and exit points to average seasonal trends.
Stocks Entering Period of Seasonal Strength Today:
Subscribers – Click on the relevant link to view the full profile. Not a subscriber? Signup here.

Guidewire Software, Inc. (NYSE:GWRE) Seasonal Chart

Invesco India ETF (NYSE:PIN) Seasonal Chart

Catalent, Inc. (NYSE:CTLT) Seasonal Chart

Accenture Ltd. (NYSE:ACN) Seasonal Chart

Yelp Inc. (NYSE:YELP) Seasonal Chart

Agnico Eagle Mines Ltd. (NYSE:AEM) Seasonal Chart

Perrigo Co. (NYSE:PRGO) Seasonal Chart

TECSYS, Inc. (TSE:TCS.TO) Seasonal Chart

iShares India 50 ETF (NASD:INDY) Seasonal Chart

CECO Environmental Corp. (NASD:CECO) Seasonal Chart

TOMI Environmental Solutions, Inc. (NASD:TOMZ) Seasonal Chart

IAMGold Corp. (TSE:IMG.TO) Seasonal Chart

WisdomTree India Earnings Fund (NYSE:EPI) Seasonal Chart
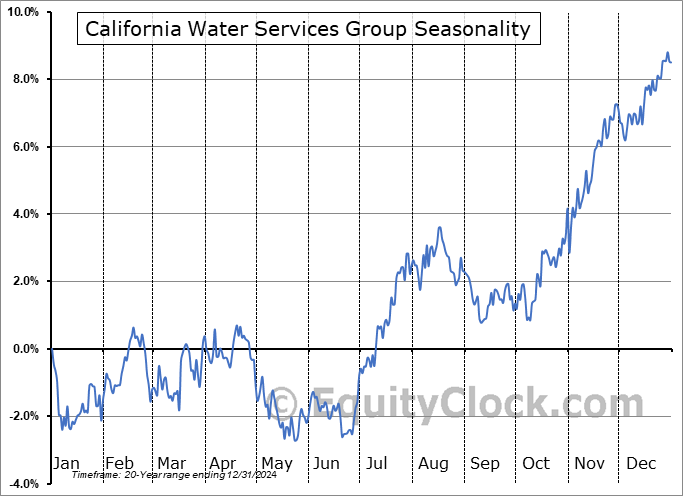
California Water Services Group (NYSE:CWT) Seasonal Chart

Boston Beer Co. Cl A (NYSE:SAM) Seasonal Chart
The Markets
Stocks closed mildly lower on Friday as investors continue to wait for a catalyst to break the market free of its prolonged trading range. The S&P 500 Index closed down by just less than two-tenths of one percent, once again ending in the band of resistance between 4100 and 4200. Support continues to be implied around the congestion of major moving averages between 3950 and 4050. Seasonal tendencies for stocks are generally lack-lustre through the week ahead until days leading up to the Memorial Day holiday in the US, when a positive drift into the event is the norm. Until the benchmark breaks the aforementioned hurdles or we get into the window when stocks typically realize the pull from the first official holiday of the summer, there is little to advocate for directional wise.

Today, in our Market Outlook to subscribers, we discuss the following:
- Weekly look at the large-cap benchmark
- US Dollar Index
- Poor market breadth
- The defensive bias of the market and what to Avoid/Accumulate
Subscribers can look for this report in their inbox or by clicking on the following link and logging in: Market Outlook for May 15
Not signed up yet? Subscribe now to receive full access to all of the research and analysis that we publish.
Sentiment on Friday, as gauged by the put-call ratio, ended bullish at 0.93.

Seasonal charts of companies reporting earnings today:


S&P 500 Index


TSE Composite


| Sponsored By... |

|


