Stock Market Outlook for May 12, 2023

The shallowest decline in initial claims through the first four months of the year since 1970 is highly indicative of a labor market that is no longer on the solid foundation that it once was.
*** Stocks highlighted are for information purposes only and should not be considered as advice to purchase or to sell mentioned securities. As always, the use of technical and fundamental analysis is encouraged in order to fine tune entry and exit points to average seasonal trends.
Stocks Entering Period of Seasonal Strength Today:
Subscribers – Click on the relevant link to view the full profile. Not a subscriber? Signup here.

Innovator IBD 50 Fund (AMEX:FFTY) Seasonal Chart

Schwab 1000 Index ETF (AMEX:SCHK) Seasonal Chart

ETF Managers Trust (AMEX:ITEQ) Seasonal Chart

Global X FinTech Thematic ETF (NASD:FINX) Seasonal Chart

SPDR S&P 1500 Momentum Tilt ETF (AMEX:MMTM) Seasonal Chart

Algonquin Power & Utilities Corp. (TSE:AQN.TO) Seasonal Chart

Hannon Armstrong Sustainable Infastructure Capital Inc. (NYSE:HASI) Seasonal Chart

PennyMac Mortgage Investment Trust (NYSE:PMT) Seasonal Chart

The Descartes Systems Group, Inc. (TSE:DSG.TO) Seasonal Chart

iShares Exponential Technologies ETF (NASD:XT) Seasonal Chart
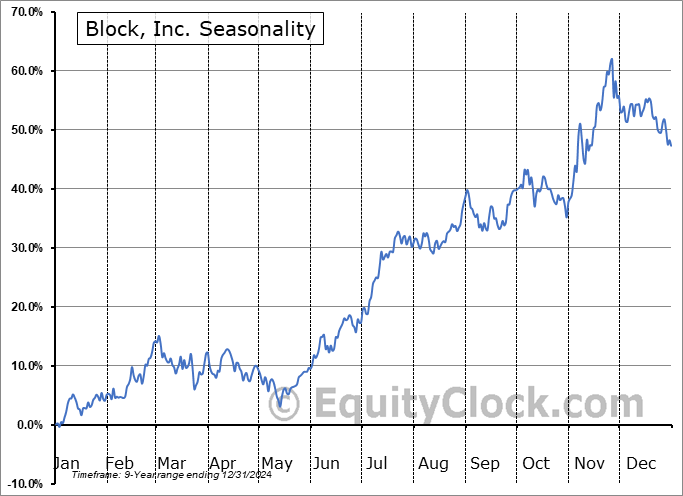
Block, Inc. (NYSE:SQ) Seasonal Chart

Teladoc Health, Inc. (NYSE:TDOC) Seasonal Chart

Global Water Resources Inc. (NASD:GWRS) Seasonal Chart

Amplify Online Retail ETF (AMEX:IBUY) Seasonal Chart

Simon Property Group, Inc. (NYSE:SPG) Seasonal Chart

Novavax, Inc. (NASD:NVAX) Seasonal Chart

Omnicell Inc. (NASD:OMCL) Seasonal Chart

Under Armour, Inc. (NYSE:UAA) Seasonal Chart

Skyworks Solutions Inc. (NASD:SWKS) Seasonal Chart

Boardwalk Equities, Inc. (TSE:BEI/UN.TO) Seasonal Chart
The Markets
Stocks, on a broad scale, continue to do a whole lot of nothing as investors scrutinze incoming macro-fundamental data and the progression of debt ceiling talks, both of which risk sending the economy into recession if not corrected shortly. The S&P 500 Index ended with a loss of just less than two-tenths of one percent, once again remaining in this band of resisatnce between 4100 and 4200. Support continues to be viewed at the congestion of major moving averages between 3950 and 4050. Until a catalyst materializes to either fuel a breaout above resistance or a breakdown below support, this range will remain. Momentum indicators continue to pullback from their April peaks and the benchmark remains on a sell signal according to MACD.

Today, in our Market Outlook to subscribers, we discuss the following:
- Risk aversion in the market continues to spread to crytocurrencies and what it could mean for technology stocks as we head towards the back half of the quarter
- The downfall of Copper
- US Producer Price Index (PPI)
- Initial Jobless Claims and the health of the labor market
- The state of Natural Gas inventories and the price of the commodity heading through the tail-end of the period of seasonal strength
Subscribers can look for this report in their inbox or by clicking on the following link and logging in: Market Outlook for May 12
Not signed up yet? Subscribe now to receive full access to all of the research and analysis that we publish.
Sentiment on Thursday, as gauged by the put-call ratio, ended slightly bullish at 0.91.

Seasonal charts of companies reporting earnings today:


S&P 500 Index


TSE Composite


| Sponsored By... |

|


