Stock Market Outlook for May 11, 2023

Used car prices just recorded one of the largest April increases on record as the declining path of prices in the category makes a dramatic turn.
*** Stocks highlighted are for information purposes only and should not be considered as advice to purchase or to sell mentioned securities. As always, the use of technical and fundamental analysis is encouraged in order to fine tune entry and exit points to average seasonal trends.
Stocks Entering Period of Seasonal Strength Today:
Subscribers – Click on the relevant link to view the full profile. Not a subscriber? Signup here.
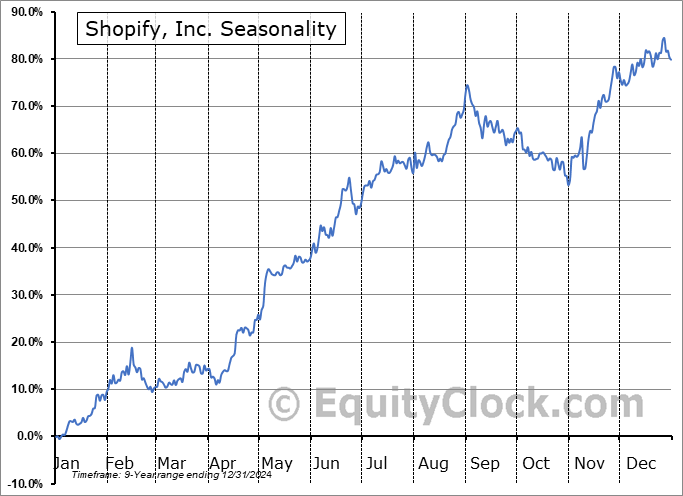
Shopify, Inc. (NYSE:SHOP) Seasonal Chart

Sea Ltd. (NYSE:SE) Seasonal Chart

SPDR FactSet Innovative Technology ETF (AMEX:XITK) Seasonal Chart

iShares MSCI USA ESG Optimized ETF (NASD:ESGU) Seasonal Chart

CME Group Inc. (NASD:CME) Seasonal Chart

Etsy Inc. (NASD:ETSY) Seasonal Chart

Gildan Activewear, Inc. (NYSE:GIL) Seasonal Chart

Amicus Therapeutics, Inc. (NASD:FOLD) Seasonal Chart
The Markets
Stocks closed generally mixed on Wednesday as investors reacted to a calmer than expected report on CPI for the month of April. The S&P 500 Index ended higher by just less than half of one percent, remaining in this zone of horizontal resistance that ranges from 4100 to 4200. Support remains similarly persistent below at the congestion of major moving averages between 3950 and 4050. Momentum indicators are struggling around their middle lines as they rollover from their recent peaks charted during the middle of April. Without a catalyst, expect this sideways grind to continue, albeit with a downside bias given the threat of an economic recession on the horizon.

Today, in our Market Outlook to subscribers, we discuss the following:
- Weekly petroleum status and our view pertaining to the price of oil and energy sector stocks
- Treasury bonds
- US Consumer Price Index (CPI)
- The new era for consumer prices in the technology sector
Subscribers can look for this report in their inbox or by clicking on the following link and logging in: Market Outlook for May 11
Not signed up yet? Subscribe now to receive full access to all of the research and analysis that we publish.
Sentiment on Wednesday, as gauged by the put-call ratio, ended close to neutral at 0.97.

Seasonal charts of companies reporting earnings today:


S&P 500 Index


TSE Composite


| Sponsored By... |

|


