Stock Market Outlook for May 9, 2023

A short-term head-and-shoulders top on the chart of Bitcoin presents a near-term risk to broader investor sentiment.
*** Stocks highlighted are for information purposes only and should not be considered as advice to purchase or to sell mentioned securities. As always, the use of technical and fundamental analysis is encouraged in order to fine tune entry and exit points to average seasonal trends.
Stocks Entering Period of Seasonal Strength Today:
Subscribers – Click on the relevant link to view the full profile. Not a subscriber? Signup here.
Columbia India Consumer ETF (NYSE:INCO) Seasonal Chart
Enovis Corporation (NYSE:ENOV) Seasonal Chart
Global X YieldCo Index ETF (NASD:RNRG) Seasonal Chart
Wedbush ETFMG Global Cloud Technology ETF (AMEX:IVES) Seasonal Chart
Renaissance IPO ETF (AMEX:IPO) Seasonal Chart
Alliant Energy Corp. (NASD:LNT) Seasonal Chart
iShares North American Tech-Software ETF (NYSE:IGV) Seasonal Chart
Neogen Corp. (NASD:NEOG) Seasonal Chart
Jack Henry & Associates, Inc. (NASD:JKHY) Seasonal Chart
Seabridge Gold Inc. (TSE:SEA.TO) Seasonal Chart
The Markets
Stocks closed mixed on Monday as investors weigh the resiliency of the labor market with ongoing concerns pertaining to a banking crisis, uncertainty over the debt ceiling limit, and the onset of an economic recession. The S&P 500 Index edged higher by a mere five basis points (0.05%), closing, yet again, in the range of resistance between 4100 and 4200. Support at the congestion of major moving averages between 3950 and 4050 continues to keep this market afloat. Momentum indicators have rolled over from their peak charted in the middle of April, leaving the benchmark on a sell signal, according to MACD. During this period of risk-aversion for the broader equity market between May and October, investors typically need reason to send stocks definitively higher over a sustainable timeframe, but with many uncertainties plaguing the market, it is difficult to foresee the buying demand materialize to break the significant barrier overhead.
Today, in our Market Outlook to subscribers, we discuss the following:
- Short-term topping pattern on the chart of Bitcoin
- Our weekly chart books update and our list of all of the segments of the market to either Accumulate or Avoid
- Trends in the Technology sector continue to look enticing
Subscribers can look for this report in their inbox or by clicking on the following link and logging in: Market Outlook for May 9
Not signed up yet? Subscribe now to receive full access to all of the research and analysis that we publish.
Want to know which areas of the market to buy or sell? Our Weekly Chart Books have just been updated, providing a clear Accumulate, Avoid, or Neutral rating for currencies, cryptocurrencies, commodities, broad markets, and subsectors/industries of the market. Subscribers can login and click on the relevant links to access.
- Currencies
- Cryptocurrencies
- Commodities
- Major Benchmarks
- Sub-sectors / Industries
- ETFs: Bonds | Commodities | Equity Markets | Industries | Sectors
Subscribe now.
Sentiment on Monday, as gauged by the put-call ratio, ended bearish at 1.06.
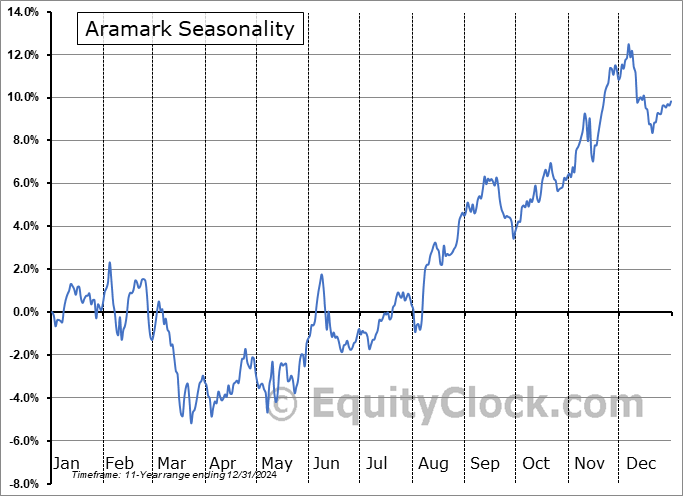
Seasonal charts of companies reporting earnings today:
S&P 500 Index
TSE Composite
| Sponsored By... |

|


