Stock Market Outlook for May 5, 2023

April payrolls average an increase of 0.7% (NSA), which, if realized, would equate to the actual addition of 1.082 million jobs.
*** Stocks highlighted are for information purposes only and should not be considered as advice to purchase or to sell mentioned securities. As always, the use of technical and fundamental analysis is encouraged in order to fine tune entry and exit points to average seasonal trends.
Stocks Entering Period of Seasonal Strength Today:
Subscribers – Click on the relevant link to view the full profile. Not a subscriber? Signup here.

CorVel Corp. (NASD:CRVL) Seasonal Chart

Powell Industries, Inc. (NASD:POWL) Seasonal Chart

Centerspace (NYSE:CSR) Seasonal Chart

Invesco DWA Technology Momentum ETF (NASD:PTF) Seasonal Chart

SPDR S&P 500 Growth ETF (NYSE:SPYG) Seasonal Chart

Churchill Downs, Inc. (NASD:CHDN) Seasonal Chart

iShares MSCI USA Momentum Factor ETF (AMEX:MTUM) Seasonal Chart
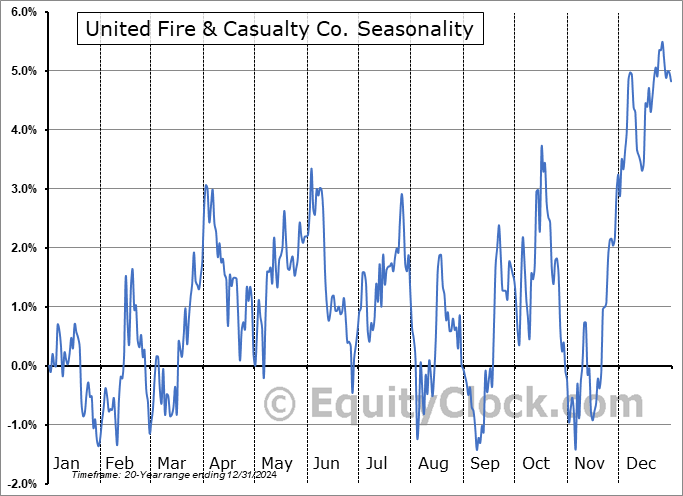
United Fire & Casualty Co. (NASD:UFCS) Seasonal Chart

Live Nation Entertainment, Inc. (NYSE:LYV) Seasonal Chart
The Markets
Ongoing concerns pertaining to a banking crisis continue to weigh on the broader market, sending stocks lower for a fourth straight session. The S&P 500 Index closed with a decline of just over seven-tenths of one percent, continuing to realize rejection from the range of resistance between 4100 and 4200. The barrier forms the basis of a double-top pattern, a setup that has downside implications of 400-points below the lower limit of the pattern and horizontal support at 3800. For now, the benchmark is maintaining support at the congestion of major moving averages in the range between 3950 to 4050, but confidence that it will be able to maintain this variable range is low given the significant barrier presented overhead and the ongoing degradation in momentum. We have reached the average peak to the best six month trend for stocks that started in October and equity market performance following this date is typically nothing to get excited about, nor something to be overly exposed to on the long side.

Today, in our Market Outlook to subscribers, we discuss the following:
- Head-and-shoulders topping pattern on the S&P 500 Equally Weighted Index and the target it suggests
- The action that we are taking in the Super Simple Seasonal Portfolio
- Weekly Jobless Claims and the health of the labor market
- Intermediate Treasury Bonds
- A look ahead at what to expect of April’s Nonfarm Payroll report
Subscribers can look for this report in their inbox or by clicking on the following link and logging in: Market Outlook for May 5
Not signed up yet? Subscribe now to receive full access to all of the research and analysis that we publish.
Sentiment on Thursday, as gauged by the put-call ratio, ended slightly bullish at 0.90.

Seasonal charts of companies reporting earnings today:


 Seasonal Chart")


S&P 500 Index


TSE Composite


| Sponsored By... |

|


