Stock Market Outlook for May 2, 2023

US Dollar Index showing a double bottom at the February low, a technical event that should concern equity investors.
*** Stocks highlighted are for information purposes only and should not be considered as advice to purchase or to sell mentioned securities. As always, the use of technical and fundamental analysis is encouraged in order to fine tune entry and exit points to average seasonal trends.
Stocks Entering Period of Seasonal Strength Today:
Subscribers – Click on the relevant link to view the full profile. Not a subscriber? Signup here.

Waste Management, Inc. (NYSE:WM) Seasonal Chart

Vector Group Ltd. (NYSE:VGR) Seasonal Chart
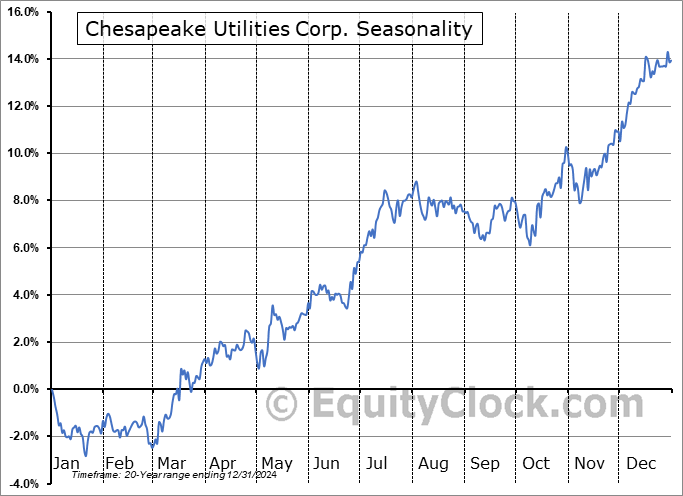
Chesapeake Utilities Corp. (NYSE:CPK) Seasonal Chart

Welltower Inc. (NYSE:WELL) Seasonal Chart

iShares Canadian Real Return Bond Index ETF (TSE:XRB.TO) Seasonal Chart

iShares 10-20 Year Treasury Bond ETF (NYSE:TLH) Seasonal Chart
The Markets
Stocks gyrated around the flat-line to start the new week and the new month as investors brace for the Fed policy announcement on Wednesday. The S&P 500 Index closed essentially unchanged, remaining within the range of resistance between 4100 and 4200. Support continues to be implied by the confluence of major moving averages in the range of 3950 to 4050. This span of support effectively marks the limits denoted by the 50 and 200-day moving averages, which are starting to converge on one another as the shorter-term average flat-lines while the longer-term average continues to rebound. Ultimately, the lack of a parallel rising path of these moving averages has yet to express a defined bullish backdrop, one where momentum is on your side to carry risk assets higher over a prolonged period. MACD remains on a sell signal that was triggered last week, ahead of the month-end rebound. Seasonally, stocks have tended to remain afloat through the first week of May, but we are at the end of the best six month trend for stocks, warranting a greater scrutiny of the technicals to provide the signal of whether to take down risk in portfolios as the market transitions into a period of risk-aversion.

Today, in our Market Outlook to subscribers, we discuss the following:
- Double-bottom on the US Dollar Index
- Ratings changes in this week’s chart books: Find out which groups you should be avoiding
- US Construction Spending
- The divergence of the price of lumber versus home construction stocks
- Struggling performance of Copper
Subscribers can look for this report in their inbox or by clicking on the following link and logging in: Market Outlook for May 2
Not signed up yet? Subscribe now to receive full access to all of the research and analysis that we publish.
Want to know which areas of the market to buy or sell? Our Weekly Chart Books have just been updated, providing a clear Accumulate, Avoid, or Neutral rating for currencies, cryptocurrencies, commodities, broad markets, and subsectors/industries of the market. Subscribers can login and click on the relevant links to access.
- Currencies
- Cryptocurrencies
- Commodities
- Major Benchmarks
- Sub-sectors / Industries
- ETFs: Bonds | Commodities | Equity Markets | Industries | Sectors
Subscribe now.
Sentiment on Monday, as gauged by the put-call ratio, ended Neutral at 0.98.

Seasonal charts of companies reporting earnings today:


 Seasonal Chart")


 Seasonal Chart")


S&P 500 Index


TSE Composite


| Sponsored By... |

|


