Stock Market Outlook for May 1, 2023

S&P 500 Index has gained an average of 0.4% in the month of May with 75% of periods closing higher.
*** Stocks highlighted are for information purposes only and should not be considered as advice to purchase or to sell mentioned securities. As always, the use of technical and fundamental analysis is encouraged in order to fine tune entry and exit points to average seasonal trends.
Stocks Entering Period of Seasonal Strength Today:
Subscribers – Click on the relevant link to view the full profile. Not a subscriber? Signup here.
Colliers International Group Inc. (TSE:CIGI.TO) Seasonal Chart
Electrovaya Inc. (TSE:EFL.TO) Seasonal Chart
Hon Industries, Inc. (NYSE:HNI) Seasonal Chart
A10 Networks, Inc. (NYSE:ATEN) Seasonal Chart
The Markets
Stocks drifted higher to close out the week and the month as investors shook off concerns pertaining to a banking crisis and instead focused on earnings, which have predominantly come in better than expected. The S&P 500 Index closed with a gain of just over eight-tenths of one percent, closing, once again, in the range of overhead resistance between 4100 and 4200. The cloud of major moving averages between 3950 and 4050 remains in a position of support, helping to carry the benchmark through to the peak of its best six month of the year trend at the start of May. MACD remains on a sell signal that was triggered around the start of this week, but this hasn’t stopped portfolio managers from stepping in as they seek to pad their books as the month comes to a close.
Today, in our Market Outlook to subscribers, we discuss the following:
- Monthly chart of the large-cap benchmark
- Tendency for stocks in the month of May
- Review of our forecasted general direction of stocks for this year
- Securities that have gained or lost in every May over their trading history
- Canada GDP
- Pipelines
Subscribers can look for this report in their inbox or by clicking on the following link and logging in: Market Outlook for May 1
Not signed up yet? Subscribe now to receive full access to all of the research and analysis that we publish.
Just released…
Our monthly report for May is out, providing all of the insight that you need to know about in order to navigate the market from a seasonal, technical, and fundamental perspective through the month(s) ahead.
Highlights in this report include:
- Equity market tendencies in the month of May
- Examination of the “Sell In May” strategy
- Shockingly weak manufacturer sentiment indicative of a manufacturing recession underway
- Shipping activity attests to the same manufacturing contraction
- Manufacturing/business weakness, but ongoing resilience in the consumer
- Consumer prices offering two opposing views on the state of inflation
- Coincident indicators still giving cause for concern
- Defense or Offense: Industry groups that provide the best of both worlds during the summer
- Building a portfolio around defense
- Cryptocurrencies on the rise and this bodes well for the trajectory of technology stocks
- Looking for an opportunity in India
- Spring is the time for real estate
- Time to overweight bonds?
- Gold
- Gold over Copper
- Fed having difficulty rolling off assets from its balance sheet
- Growth over Value
- Lack of expansion of the new 52-week high list
- Our list of all segments of the market to either Accumulate or Avoid, along with relevant ETFs
- Positioning for the months ahead
- Sector Reviews and Ratings
- Stocks that have Frequently Gained in the Month of May
- Notable Stocks and ETFs Entering their Period of Strength in May
Look for this report in your inbox or via the archive at https://charts.equityclock.com/
Not subscribed yet? Sign up to our service now to receive this report and all of the research that we publish highlighting seasonal, technical, and fundamental setups in the economy and the market.
With the new month upon us and as we celebrate the release of our monthly report for May, today we release our screen of all of the stocks that have gained in every May over their trading history. While we at Equity Clock focus on a three-pronged approach (seasonal, technical, and fundamental analysis) to gain exposure to areas of the market that typically perform well over intermediate (2 to 6 months) timeframes, we know that stocks that have a 100% frequency of success for a particular month is generally of interest to those pursuing a seasonal investment strategy. Below are the results:
And how about those securities that have never gained in this fifth month of the year, here they are:
*Note: None of the results highlighted above have the 20 years of data that we like to see in order to accurately gauge the annual recurring, seasonal influences impacting an investment, therefore the reliability of the results should be questioned. We present the above list as an example of how our downloadable spreadsheet available to yearly subscribers can be filtered.
Sentiment on Friday, as gauged by the put-call ratio, ended neutral at 0.99.
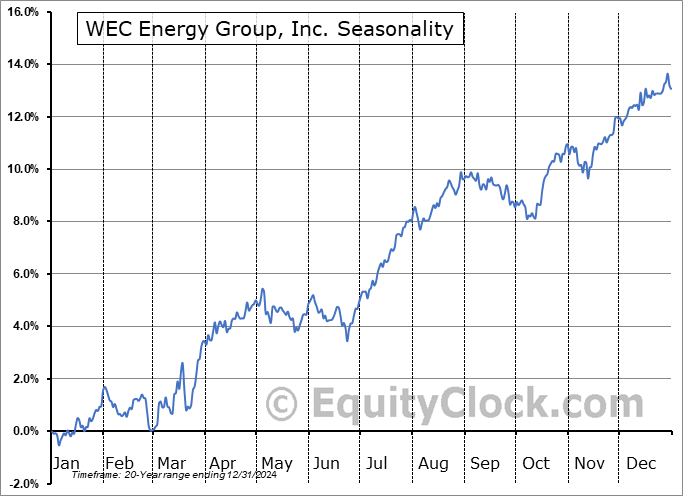
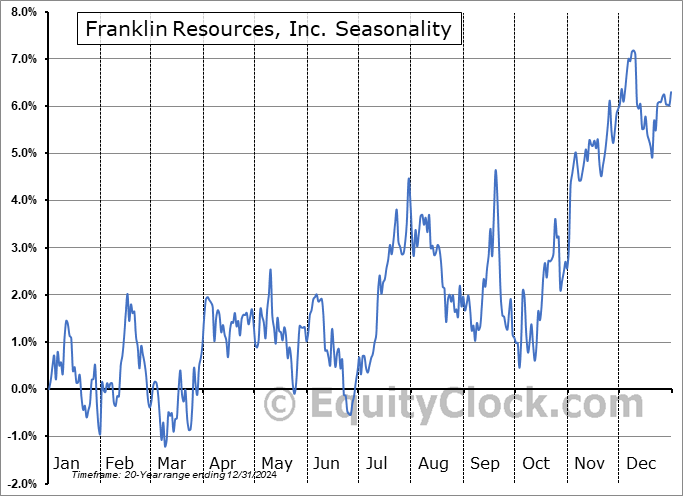
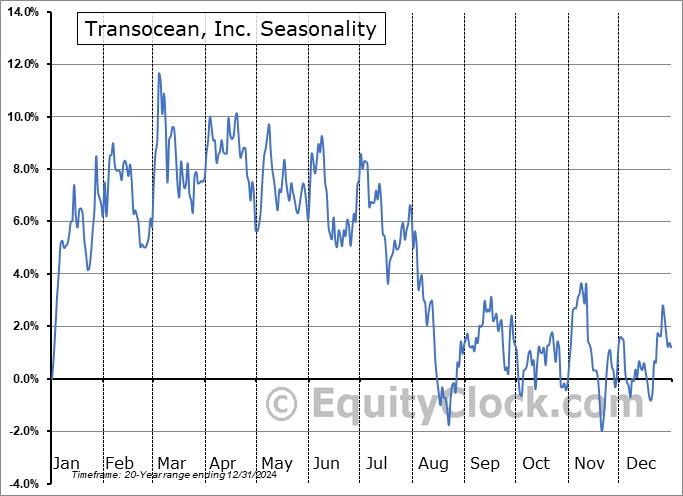
Seasonal charts of companies reporting earnings today:
S&P 500 Index
TSE Composite
| Sponsored By... |

|


