Stock Market Outlook for April 27, 2023

Head-and-shoulders topping patterns are becoming abundant across the charts.
*** Stocks highlighted are for information purposes only and should not be considered as advice to purchase or to sell mentioned securities. As always, the use of technical and fundamental analysis is encouraged in order to fine tune entry and exit points to average seasonal trends.
Stocks Entering Period of Seasonal Strength Today:
Subscribers – Click on the relevant link to view the full profile. Not a subscriber? Signup here.

Apple, Inc. (NASD:AAPL) Seasonal Chart

Alphabet Inc. – Class C (NASD:GOOG) Seasonal Chart
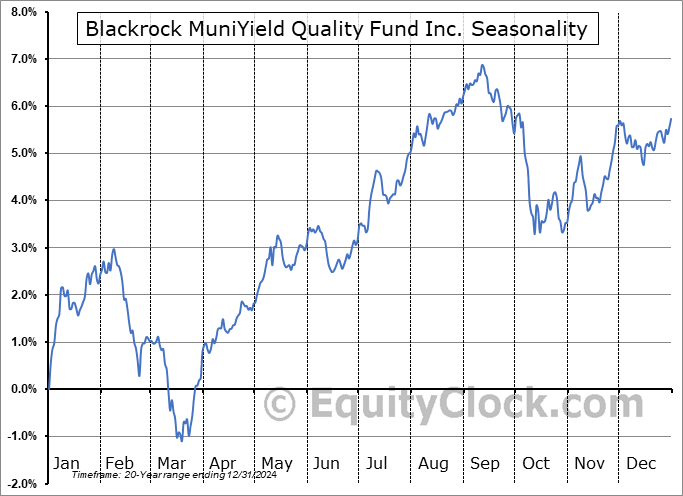
Blackrock MuniYield Quality Fund Inc. (NYSE:MQY) Seasonal Chart

Vanguard S&P 500 Growth ETF (NYSE:VOOG) Seasonal Chart

Valvoline Inc. (NYSE:VVV) Seasonal Chart

Tech Achievers Growth & Income Fund (TSE:HTA.TO) Seasonal Chart
The Markets
Stocks traded generally lower on Wednesday as the market continues to take down exposure to core-cyclical assets in preparation for the threat of the onset of an economic recession. The S&P 500 Index closed lower by just less than four-tenths of one percent, continuing to roll over from overhead resistance between 4100 and 4200. As highlighted in our last report, a MACD sell signal has now been triggered as momentum indicators continue to profile a market that lacks upside enthusiasm. The benchmark is currently reaching into the range of moving averages between 3950 and 4050, searching for a point of support to stem the tide of selling pressures that has bubbled up in the riskiest, most economically sensitive segments of the market (eg. energy, industrials, materials, financials) in recent sessions.

Today, in our Market Outlook to subscribers, we discuss the following:
- Head-and-shoulders topping patterns across the charts of major ETFs
- Treasury bond prices increasingly showing a bottoming setup
- Weekly petroleum status, including the state of supply and demand, along with the technicals in the energy market
- US Durable Goods Orders
- US International Trade, the reducing trade deficit, and what this means for the economy and for stocks
Subscribers can look for this report in their inbox or by clicking on the following link and logging in: Market Outlook for April 27
Not signed up yet? Subscribe now to receive full access to all of the research and analysis that we publish.
Sentiment on Wednesday, as gauged by the put-call ratio, ended bearish at 1.04.

Seasonal charts of companies reporting earnings today:


 Seasonal Chart")


 Seasonal Chart")


S&P 500 Index


TSE Composite


| Sponsored By... |

|


