Stock Market Outlook for March 24, 2023

Coincident indicators continue to hint that an economic recession is underway.
*** Stocks highlighted are for information purposes only and should not be considered as advice to purchase or to sell mentioned securities. As always, the use of technical and fundamental analysis is encouraged in order to fine tune entry and exit points to average seasonal trends.
Stocks Entering Period of Seasonal Strength Today:
Subscribers – Click on the relevant link to view the full profile. Not a subscriber? Signup here.

FS Investment Corp. (NYSE:FSK) Seasonal Chart

Global X Health & Wellness Thematic ETF (NASD:BFIT) Seasonal Chart

Nuveen Short-Term REIT ETF (AMEX:NURE) Seasonal Chart

Via Renewables, Inc. (NASD:VIA) Seasonal Chart
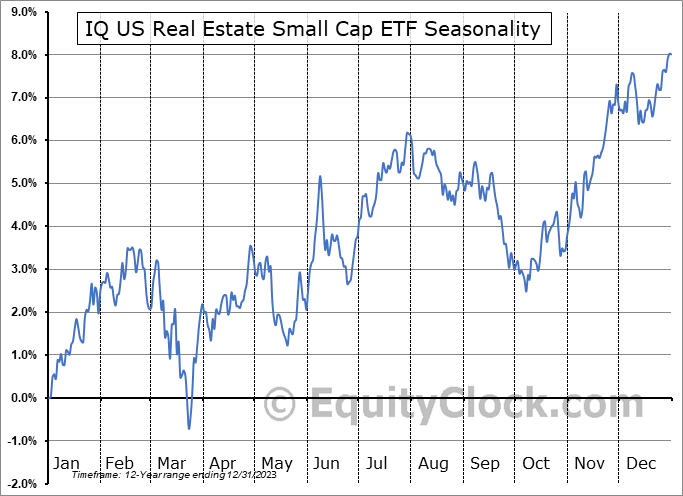
IQ US Real Estate Small Cap ETF (NYSE:ROOF) Seasonal Chart

Amazon.com, Inc. (NASD:AMZN) Seasonal Chart

BlackRock International Growth and Income Trust (NYSE:BGY) Seasonal Chart

Mid-America Apartment Communities Inc. (NYSE:MAA) Seasonal Chart

CALAMOS Convertible Opportunities and Income Fund (NASD:CHI) Seasonal Chart

ProShares Ultra NASDAQ Biotechnology (NASD:BIB) Seasonal Chart

LKQ Corp. (NASD:LKQ) Seasonal Chart

Worthington Industries, Inc. (NYSE:WOR) Seasonal Chart

Pentair, Inc. (NYSE:PNR) Seasonal Chart
The Markets
Stocks fluctuated in an extreme manner on Thursday as investors digested the headline risks in the market that remain ongoing. The S&P 500 Index closed with a gain of three-tenths of one percent, charting an indecisive doji candlestick in the midst of this confluence of resistance at major moving average in the range of 3900 to 4000. The benchmark traded to as high as the 50-day moving average (4014) at the height of the session and sellers showed up en masse, briefly driving the benchmark into negative territory after gaining almost two percent in the early morning trade. The reversal also comes at the upper limit of short-term declining trendline resistance that has capped the benchmark since the high set at the start of February, emphasizing the short-term path of lower-lows and lower-highs that the benchmark remains. The December low at 3764 is the important level to watch as it pertains to the intermediate-term path as a violation of this hurdle would conclude what is still viewed as a trend of higher-highs and higher-lows stemming from the October low. The shift of the intermediate path from positive to negative would place the October lows at risk, particularly should various coincident indications of economic activity continue to evolve unfavourably, signalling the onset of a recession.

Today, in our Market Outlook to subscribers, we discuss the following:
- Credit Spreads
- Weekly Jobless Claims and the health of the labor market
- US New Home Sales and the stocks of the home builders
Subscribers can look for this report in their inbox or by clicking on the following link and logging in: Market Outlook for March 24
Not signed up yet? Subscribe now to receive full access to all of the research and analysis that we publish.
Sentiment on Thursday, as gauged by the put-call ratio, ended bearish at 1.13.

Seasonal charts of companies reporting earnings today:


S&P 500 Index


TSE Composite


| Sponsored By... |

|


