Stock Market Outlook for March 23, 2023

Treasury yield spreads are showing signs of bottoming and this is not a good thing.
*** Stocks highlighted are for information purposes only and should not be considered as advice to purchase or to sell mentioned securities. As always, the use of technical and fundamental analysis is encouraged in order to fine tune entry and exit points to average seasonal trends.
Stocks Entering Period of Seasonal Strength Today:
Subscribers – Click on the relevant link to view the full profile. Not a subscriber? Signup here.

Energy Select Sector SPDR Fund (NYSE:XLE) Seasonal Chart

BlackRock Enhanced Capital and Income Fund, Inc. (NYSE:CII) Seasonal Chart

Direxion Daily Healthcare Bull 3x Shares (NYSE:CURE) Seasonal Chart

Fidelity MSCI Materials Index ETF (AMEX:FMAT) Seasonal Chart

iShares Global Energy ETF (NYSE:IXC) Seasonal Chart
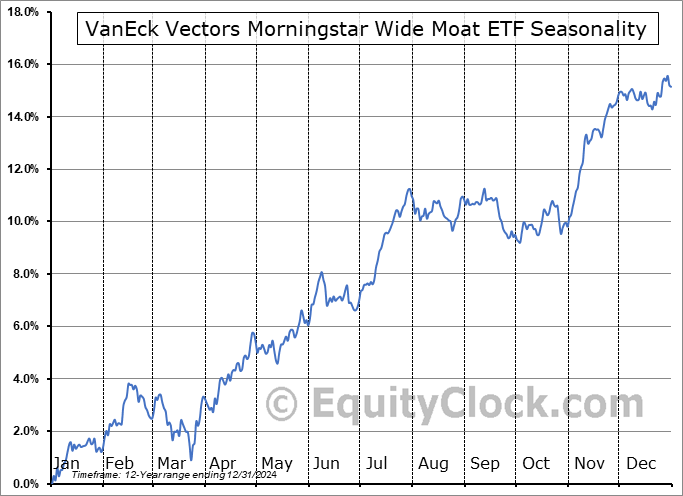
VanEck Vectors Morningstar Wide Moat ETF (AMEX:MOAT) Seasonal Chart

Element Solutions Inc. (NYSE:ESI) Seasonal Chart

Primo Water Corporation (NYSE:PRMW) Seasonal Chart

Devon Energy Corp. (NYSE:DVN) Seasonal Chart

Marathon Oil (NYSE:MRO) Seasonal Chart

Surge Energy Inc. (TSE:SGY.TO) Seasonal Chart

NRG Energy Inc. (NYSE:NRG) Seasonal Chart

AutoCanada Inc. (TSE:ACQ.TO) Seasonal Chart

AES Corp. (NYSE:AES) Seasonal Chart

CAE, Inc. (NYSE:CAE) Seasonal Chart
The Markets
Stocks and bond yields dropped on Wednesday as the market reacted to the latest FOMC meeting announcement. The S&P 500 Index closed down by 1.65%, showing a sharp negative reaction around now intermediate resistance at the 50-day moving average. The confluence of major moving averages, including the 20, 50, and 200-day, in the range between 3900 and 4000 remains a formidable barrier preventing the equity benchmark from achieving the strength that is typical of this period heading into the start of spring; until the hurdle is broken, it has to be expected that it will cap the near-term trajectory until the uncertainty in the market alleviates. The December low at 3764 remains a critical level to watch as a violation of this hurdle would start to imply negative intermediate implications beyond the short-term burden that has been experienced since the start of February. In a recessionary economic framework, a break below the December low and the rising 200-week moving average at 3736 would be the base case and it is certainly not the environment that we want to have a positive correlation to risk assets within investment portfolios.

Today, in our Market Outlook to subscribers, we discuss the following:
- The bounce of traditional safe-havens of treasury bonds and gold
- Interest rate sensitive segments of the market still suffering, despite the plunge in the cost of borrowing
- The shift towards the normalization of the treasury yield curve
- Weekly EIA Petroleum Status and the seasonal trade in the energy sector
Subscribers can look for this report in their inbox or by clicking on the following link and logging in: Market Outlook for March 23
Not signed up yet? Subscribe now to receive full access to all of the research and analysis that we publish.
Sentiment on Wednesday, as gauged by the put-call ratio, ended bullish at 0.87.

Seasonal charts of companies reporting earnings today:


S&P 500 Index


TSE Composite


| Sponsored By... |

|


