Stock Market Outlook for March 20, 2023

Shipping activity is struggling, typically a hallmark indicator of an economic slowdown/recession on the horizon.
*** Stocks highlighted are for information purposes only and should not be considered as advice to purchase or to sell mentioned securities. As always, the use of technical and fundamental analysis is encouraged in order to fine tune entry and exit points to average seasonal trends.
Stocks Entering Period of Seasonal Strength Today:
Subscribers – Click on the relevant link to view the full profile. Not a subscriber? Signup here.

ProShares DJ Brookfield Global Infrastructure ETF (NYSE:TOLZ) Seasonal Chart

iShares Global Infrastructure Index ETF (NASD:IGF) Seasonal Chart

iShares Long-Term Corporate Bond ETF (AMEX:IGLB) Seasonal Chart

Invesco DWA Emerging Markets Momentum ETF (NASD:PIE) Seasonal Chart

Pimco Corporate Opportunity (NYSE:PTY) Seasonal Chart

iShares U.S. IG Corporate Bond Index ETF (CAD-Hedged) (TSE:XIG.TO) Seasonal Chart

Diamondback Energy, Inc. (NASD:FANG) Seasonal Chart

NextEra Energy Partners, LP (NYSE:NEP) Seasonal Chart

DIRTT Environmental Solutions Ltd. (TSE:DRT.TO) Seasonal Chart

Invesco Taxable Municipal Bond ETF (NYSE:BAB) Seasonal Chart

iShares MSCI United Kingdom ETF (NYSE:EWU) Seasonal Chart

First Trust Natural Gas ETF (NYSE:FCG) Seasonal Chart

RBC Bearings Inc. (NYSE:RBC) Seasonal Chart

Invitation Homes Inc. (NYSE:INVH) Seasonal Chart

Rogers Communications, Inc. (TSE:RCI/A.TO) Seasonal Chart

North West Co. Inc. (TSE:NWC.TO) Seasonal Chart

Invesco S&P Spin-Off ETF (NYSE:CSD) Seasonal Chart
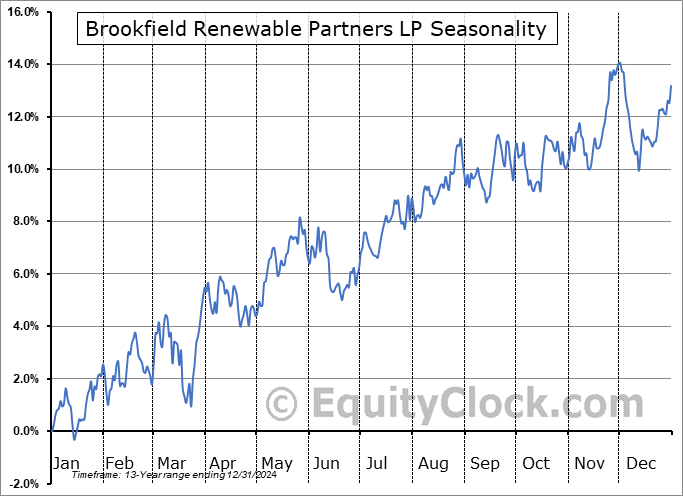
Brookfield Renewable Partners LP (NYSE:BEP) Seasonal Chart
The Markets
Stocks slipped into the end of the week as core cyclical sectors of energy, materials, industrials, and financials took another leg lower as market participants price in the prospect of a recession on the horizon. The S&P 500 Index shed 1.10%, falling from the declining 20-day moving average at 3966 and once again confirming the short-term variable hurdle as a point of resistance in the ongoing path of lower-lows and lower-highs stemming from the peak charted at the start of February. The benchmark finds itself at the end of the week back below its declining 200-day moving average at 3936, which, outside of the negative short-term path, continues to present significant caution to the long-term trajectory of the market while below, particularly on a weekly closing basis. The critical level on the downside remains the December low at 3764 as a break below this hurdle would likely unleash the next wave of selling pressures. While we have no reason to look to be accumulators of the broad equity market benchmark with the technical and fundamental backdrop being presented, we may still see some stability return to the market in the short-term as positive seasonal tendencies lift stocks into the end of the quarter and through the start of the next. We would be unable to check the three prongs to our approach (seasonal, technical, and fundamental) to advocate for a bullish bet, but it is also difficult to be aggressively bearish through this timeframe when funds typically flow into the market. As has been highlighted within our chart books updates, there are segments of the market that we want to Accumulate and those that we want to Avoid, but we would expect that, should the macro economic backdrop continue to deteriorate, a broader swath of equity segments to Avoid will be presented by the time we get to the off-season for stocks at the end of April/start of May.

Today, in our Market Outlook to subscriber, we discuss the following:
- Weekly look at the large-cap benchmark and our forecasted path for stocks
- Collapse of investor sentiment and equity exposure
- US Industrial Production
- Shipping Volumes and Expenditures
- The Dow Jones Transportation Average
Subscribers can look for this report in their inbox or by clicking on the following link and logging in: Market Outlook for March 20
Not signed up yet? Subscribe now to receive full access to all of the research and analysis that we publish.
Sentiment on Friday, as gauged by the put-call ratio, ended bearish at 1.02.

Seasonal charts of companies reporting earnings today:


S&P 500 Index


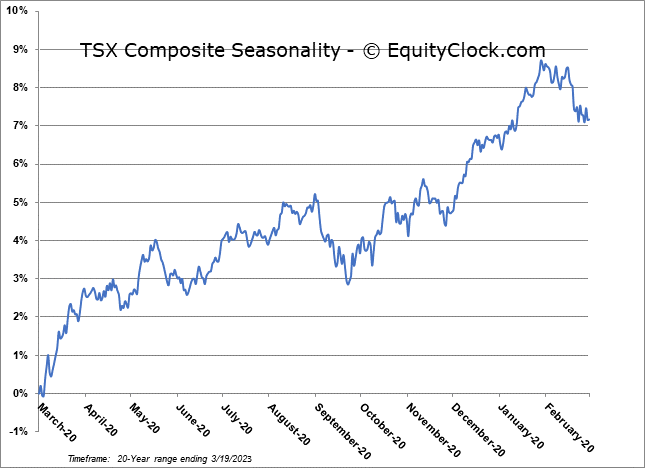
TSE Composite

| Sponsored By... |

|


