Stock Market Outlook for March 17, 2023

Real Time Economic Calendar provided by Investing.com.
*** Stocks highlighted are for information purposes only and should not be considered as advice to purchase or to sell mentioned securities. As always, the use of technical and fundamental analysis is encouraged in order to fine tune entry and exit points to average seasonal trends.
Stocks Entering Period of Seasonal Strength Today:
Subscribers – Click on the relevant link to view the full profile. Not a subscriber? Signup here.
Global X MLP ETF (AMEX:MLPA) Seasonal Chart
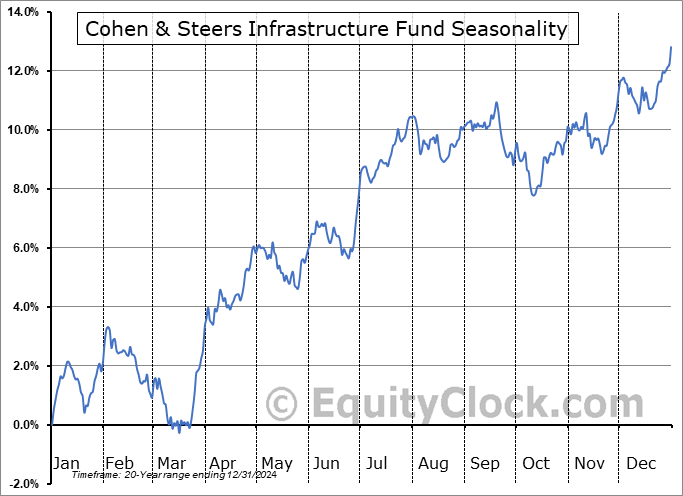
Cohen & Steers Infrastructure Fund (NYSE:UTF) Seasonal Chart

Invesco S&P 100 Equal Weight ETF (AMEX:EQWL) Seasonal Chart

WisdomTree Europe Hedged SmallCap Equity Fund (AMEX:EUSC) Seasonal Chart

Global X SuperDividend Alternatives ETF (NASD:ALTY) Seasonal Chart

Vanguard International Dividend Appreciation ETF (NASD:VIGI) Seasonal Chart

Barclays iPath Select MLP ETN (AMEX:ATMP) Seasonal Chart

Shell Plc (NYSE:SHEL) Seasonal Chart

CI Financial Corp. (TSE:CIX.TO) Seasonal Chart

Black Diamond Group Ltd. (TSE:BDI.TO) Seasonal Chart
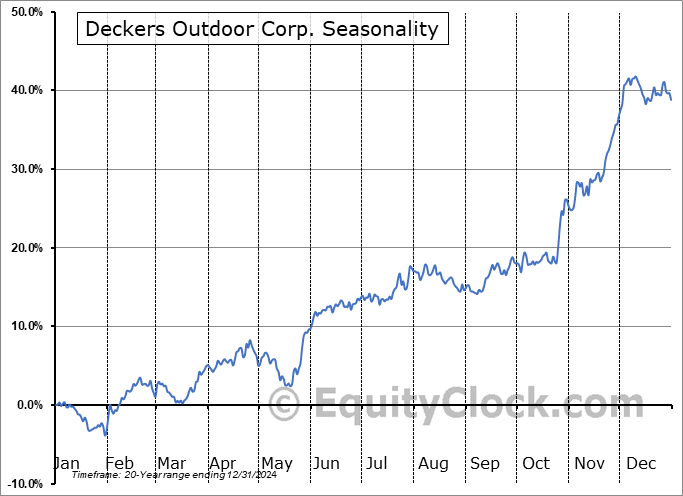
Deckers Outdoor Corp. (NYSE:DECK) Seasonal Chart

TransAlta Corp. (NYSE:TAC) Seasonal Chart

Constellation Brands, Inc. (NYSE:STZ) Seasonal Chart

Tidewater Midstream and Infrastructure Ltd. (TSE:TWM.TO) Seasonal Chart

BMO Long Corporate Bond Index ETF (TSE:ZLC.TO) Seasonal Chart

Coca Cola Co. (NYSE:KO) Seasonal Chart

Williams Cos., Inc. (NYSE:WMB) Seasonal Chart

Guess?, Inc. (NYSE:GES) Seasonal Chart

Ashland Global Holdings Inc. (NYSE:ASH) Seasonal Chart

Diageo PLC (NYSE:DEO) Seasonal Chart

Oneok, Inc. (NYSE:OKE) Seasonal Chart

Restaurant Brands International Inc. (NYSE:QSR) Seasonal Chart

FirstService Corp. (NASD:FSV) Seasonal Chart

Global X SuperDividend US ETF (AMEX:DIV) Seasonal Chart

First Trust Dow Jones Internet Index Fund (NYSE:FDN) Seasonal Chart

VanEck Vectors High Yield Municipal Index ETF (NYSE:HYD) Seasonal Chart

Renaissance International IPO ETF (AMEX:IPOS) Seasonal Chart

Invesco Active U.S. Real Estate ETF (NYSE:PSR) Seasonal Chart
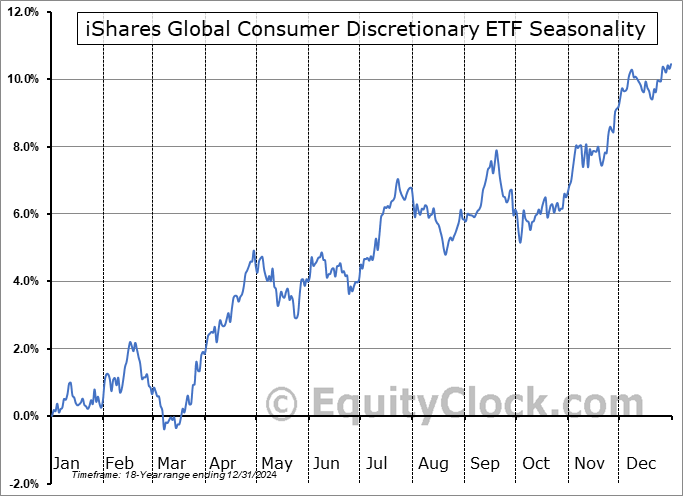
iShares Global Consumer Discretionary ETF (NYSE:RXI) Seasonal Chart

Global X SuperDividend REIT ETF (NASD:SRET) Seasonal Chart

Spin Master Corp. (TSE:TOY.TO) Seasonal Chart

Vanguard Global Minimum Volatility ETF (TSE:VVO.TO) Seasonal Chart
The Markets
Stocks rebounded on Thursday as bank stocks stabilized following the extreme pressure of recent days. The S&P 500 Index closed with a gain of 1.76%, ending just below short-term resistance at the declining 20-day moving average. The short-term variable hurdle remains in a position to cap the still negative short-term path of lower-lows and lower-highs stemming from the early February peak. But it is the important level of support on the downside at December the lows that we are most interested in. A break below 3764 would violate the intermediate path of higher-highs and higher-lows and would inevitably draw in the next wave of selling pressures. Momentum indicators for the large-cap benchmark have already broken those December lows, hinting of the same for price, and various benchmarks that are heavy with cyclical exposure (eg. the Dow Jones Industrial Average) have similarly broken their December low hurdle. While the debate can be made pertaining to the intermediate path of the benchmark, there remains sufficient evidence that this market is no longer being supported given the events of recent days and this is a risky backdrop to consider adding equity exposure, despite the positive seasonal tendencies that are normal over the next month and a half.
Sentiment on Thursday, as gauged by the put-call ratio, ended close to neutral at 0.99.Today, in our Market Outlook to subscribers, we discuss the following:
Subscribers can look for this report in their inbox or by clicking on the following link and logging in: Market Outlook for March 17 Not signed up yet? Subscribe now to receive full access to all of the research and analysis that we publish.
- The technical setups of “growthy” segments of the market, including the Q’s (QQQ) and the Semiconductor ETF (SMH)
- Upside exhaustion for the VIX
- Jobless Claims and the health of the labor market
- Philadelphia Fed Manufacturing Index
- US Housing Starts and the stocks of the home builders
 Seasonal charts of companies reporting earnings today:


S&P 500 Index


TSE Composite


| Sponsored By... |

|


