Stock Market Outlook for March 16, 2023
 In a recessionary market backdrop, investors will abandon all cyclical assets and flee to safe haven bets, a rotation that was readily apparent on Wednesday.
Real Time Economic Calendar provided by Investing.com.
*** Stocks highlighted are for information purposes only and should not be considered as advice to purchase or to sell mentioned securities. As always, the use of technical and fundamental analysis is encouraged in order to fine tune entry and exit points to average seasonal trends.
Stocks Entering Period of Seasonal Strength Today:
Subscribers – Click on the relevant link to view the full profile. Not a subscriber? Signup here.
International Petroleum Corp. (TSE:IPCO.TO) Seasonal Chart

Avient Corporation (NYSE:AVNT) Seasonal Chart

ProShares Ultra Real Estate (NYSE:URE) Seasonal Chart

ALPS Sector Dividend Dogs ETF (AMEX:SDOG) Seasonal Chart

SPDR MSCI EAFE Quality Mix ETF (AMEX:QEFA) Seasonal Chart

Global X MLP & Energy Infrastructure ETF (AMEX:MLPX) Seasonal Chart

Dover Corp. (NYSE:DOV) Seasonal Chart

LGI Homes, Inc. (NASD:LGIH) Seasonal Chart

MEG Energy Corp. (TSE:MEG.TO) Seasonal Chart

Ecopetrol SA (NYSE:EC) Seasonal Chart

ENI S.P.A. (NYSE:E) Seasonal Chart

Anheuser-Busch InBev ADR (NYSE:BUD) Seasonal Chart

LL Flooring Holdings, Inc. (NYSE:LL) Seasonal Chart
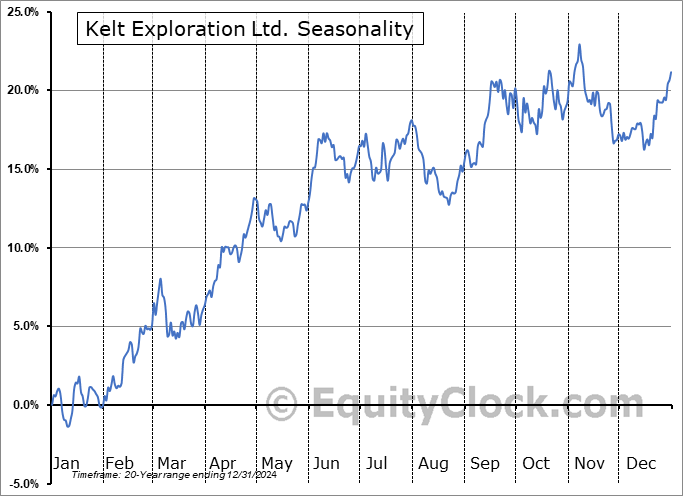
Kelt Exploration Ltd. (TSE:KEL.TO) Seasonal Chart

Ulta Beauty, Inc. (NASD:ULTA) Seasonal Chart
The Markets
Stocks struggled again on Wednesday as focus turned to European financials following the turmoil that has been experienced in the US banking sector during recent sessions. The S&P 500 Index closed down by just over seven-tenths of one percent, remaining stuck below the confluence of major moving averages, now resistance, in the range of 3900 to 4000. Long lower-wick candlesticks presented in recent days have given indication of selling exhaustion, but any strength realized from this point, without some upside catalyst, is likely to be just another evolution of lower-lows and lower-highs within a short-term declining trend, capped around the declining 20-day moving average at 3985. The important hurdle to scrutinize on the downside is the December low at 3764 as this would bring to an end the rising intermediate path stemming form the October low. Momentum indicators have readopted characteristics of a bearish trend below their middle lines and they have already moved below the lows set in December, hinting of the same for price ahead. Below 3764, the October lows are an easy target, but the ultimate low in the market should a recession indeed take hold would be expected to be much lower than that.
Sentiment on Wednesday, as gauged by the put-call ratio, ended neutral at 1.00.Today, in our Market Outlook to subscribers, we discuss the following:
Subscribers can look for this report in their inbox or by clicking on the following link and logging in: Market Outlook for March 16 Not signed up yet? Subscribe now to receive full access to all of the research and analysis that we publish.
- The downfall of European financials
- Divergence between the direction of yields and the dollar
- The fundamental backdrop to the energy market and the break of trend for the sector
- The action that we are taking in the Super Simple Seasonal Portfolio
- Empire State Manufacturing Survey
- Producer Price Index (PPI)
- US Retail Sales
 Seasonal charts of companies reporting earnings today:


S&P 500 Index


TSE Composite


| Sponsored By... |

|


