Stock Market Outlook for March 15, 2023

Real Time Economic Calendar provided by Investing.com.
*** Stocks highlighted are for information purposes only and should not be considered as advice to purchase or to sell mentioned securities. As always, the use of technical and fundamental analysis is encouraged in order to fine tune entry and exit points to average seasonal trends.
Stocks Entering Period of Seasonal Strength Today:
Subscribers – Click on the relevant link to view the full profile. Not a subscriber? Signup here.
Tortoise Power & Energy Infrastructure Fund Inc. (NYSE:TPZ) Seasonal Chart

iShares Global Utilities ETF (NYSE:JXI) Seasonal Chart

Invesco FTSE RAFI Developed Markets ex-U.S. Small-Mid ETF (NYSE:PDN) Seasonal Chart

Vanguard FTSE Developed Markets ETF (NYSE:VEA) Seasonal Chart

Vanguard FTSE All-World ex-US ETF (NYSE:VEU) Seasonal Chart

iShares Core MSCI Total International Stock ETF (NASD:IXUS) Seasonal Chart

First Trust International IPO ETF (NASD:FPXI) Seasonal Chart

Roku, Inc. (NASD:ROKU) Seasonal Chart

Lincoln Electric Holdings, Inc. (NASD:LECO) Seasonal Chart

Empire Co. Ltd. (TSE:EMP/A.TO) Seasonal Chart
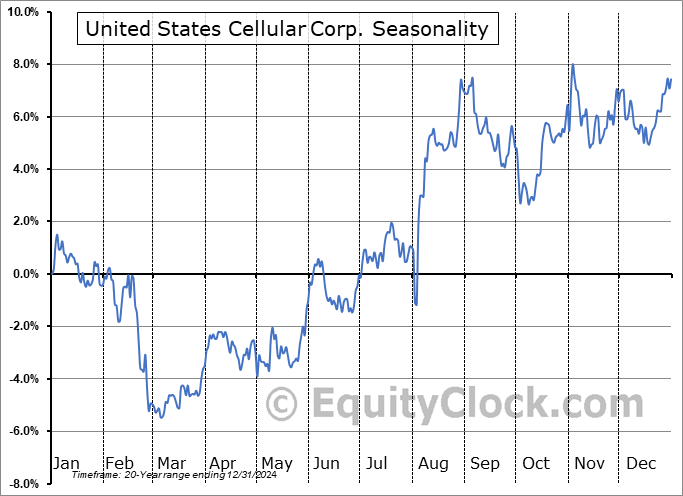
United States Cellular Corp. (NYSE:USM) Seasonal Chart

Vista Outdoor Inc. (NYSE:VSTO) Seasonal Chart

iShares MSCI ACWI ETF (NASD:ACWI) Seasonal Chart

ConAgra Brands, Inc. (NYSE:CAG) Seasonal Chart

SPDR MSCI ACWI ex-US ETF (NYSE:CWI) Seasonal Chart

SPDR S&P International Dividend ETF (NYSE:DWX) Seasonal Chart

iShares MSCI EAFE Value ETF (NYSE:EFV) Seasonal Chart

Alerian Energy Infrastructure ETF (AMEX:ENFR) Seasonal Chart
The Markets
Stocks stabilized on Tuesday in a reflux reaction following the sharp downdraft of recent sessions amidst concerns of the onset of a banking crisis. The S&P 500 Index closed higher by 1.68%, remaining below major moving averages. At the highs of the session, the large-cap benchmark reached back to and tested recently broken support at the declining 200-day moving average, a test that had investors selling into the critical long-term hurdle. The long upper-wick candlestick below this hurdle and what is the confluence of major moving averages in the range of 3900 to 4000 appears highly threatening and suggests that the bears have control of the tape. Lower values for the benchmark is the obvious conclusion. Momentum indicators continue to take positions in the lower half of their ranges, which is characteristic of a bearish trend. The critical hurdle to watch on the downside is the December low at 3764; below this, the intermediate trend of higher-highs and higher-lows would no longer be intact, potentially unleashing the next wave of selling pressures as investors seek to contain risk within portfolios.
Sentiment on Tuesday, as gauged by the put-call ratio, ended bearish at 1.08.Today, in our Market Outlook to subscribers, we discuss the following:
Subscribers can look for this report in their inbox or by clicking on the following link and logging in: Market Outlook for March 15 Not signed up yet? Subscribe now to receive full access to all of the research and analysis that we publish.
- Equity market breadth indicators have re-adopted characteristics of a bearish trend
- What the Copper/Gold Ratio is saying
- US Consumer Price Index (CPI)
 Seasonal charts of companies reporting earnings today:


 Inc. Seasonal Chart")


S&P 500 Index


TSE Composite


| Sponsored By... |

|


