Stock Market Outlook for March 13, 2023

Real Time Economic Calendar provided by Investing.com.
*** Stocks highlighted are for information purposes only and should not be considered as advice to purchase or to sell mentioned securities. As always, the use of technical and fundamental analysis is encouraged in order to fine tune entry and exit points to average seasonal trends.
Stocks Entering Period of Seasonal Strength Today:
Subscribers – Click on the relevant link to view the full profile. Not a subscriber? Signup here.
Invesco International Dividend Achievers ETF (NASD:PID) Seasonal Chart

iShares International Developed Real Estate ETF (NASD:IFGL) Seasonal Chart

iShares MSCI France ETF (NYSE:EWQ) Seasonal Chart

American Intl Group, Inc. (NYSE:AIG) Seasonal Chart

ABB Ltd. (NYSE:ABB) Seasonal Chart
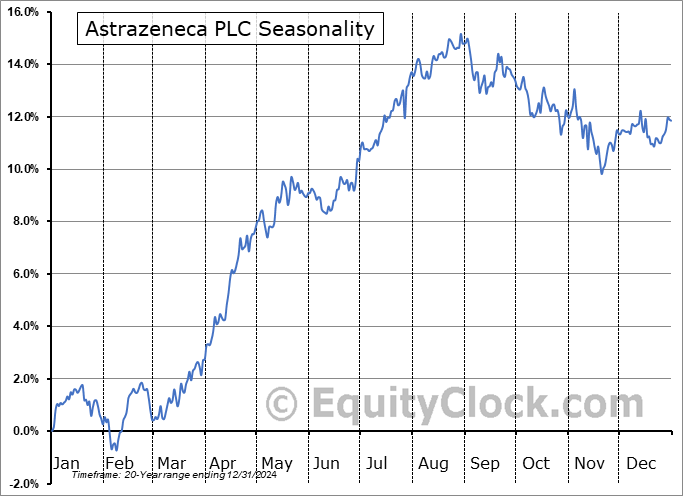
Astrazeneca PLC (NASD:AZN) Seasonal Chart

Pine Cliff Energy Ltd. (TSE:PNE.TO) Seasonal Chart

Peyto Exploration & Development Corp. (TSE:PEY.TO) Seasonal Chart

NuVista Energy Ltd. (TSE:NVA.TO) Seasonal Chart

SPDR STOXX Europe 50 ETF (NYSE:SPEU) Seasonal Chart

SPDR S&P World ex-US ETF (AMEX:SPDW) Seasonal Chart

iShares MSCI Kokusai ETF (NYSE:TOK) Seasonal Chart
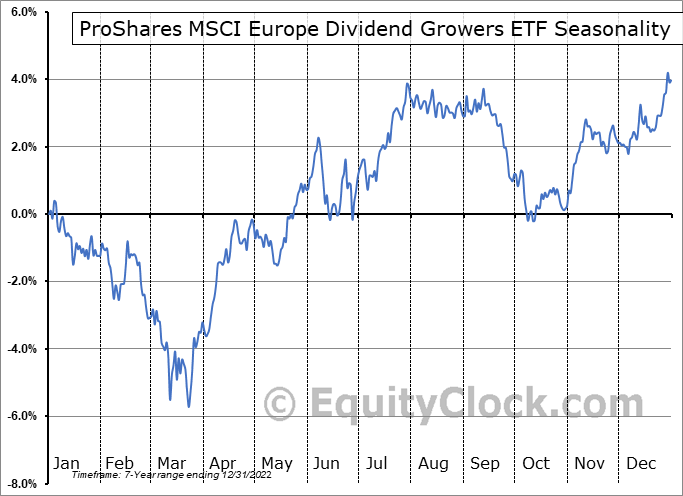
ProShares MSCI Europe Dividend Growers ETF (NYSE:EUDV) Seasonal Chart

Snap On Inc. Holding Co. (NYSE:SNA) Seasonal Chart

Align Technology, Inc. (NASD:ALGN) Seasonal Chart

Ship Finance Intl Ltd. (NYSE:SFL) Seasonal Chart

SAP SE (NYSE:SAP) Seasonal Chart

Murphy Oil Corp. Holding Co. (NYSE:MUR) Seasonal Chart

iShares MSCI EAFE Growth ETF (NYSE:EFG) Seasonal Chart

iShares Core MSCI EAFE ETF (AMEX:IEFA) Seasonal Chart
The Markets
Stocks continued their selloff on Friday as fears of financial contagion ballooned amidst the fallout from the collapse of SVB Financial. The S&P 500 Index closed down by 1.45%, moving definitively below support presented by major moving averages in the range between 3900 and 4000 and retaking levels below previous declining trendline resistance that currently sits at 3880. In a striking shift from the observation that we made just one week ago, this market is no longer being supported as we head towards what is traditionally a strong time of year for stocks through March and April. Momentum indicators are re-adopting characteristics of a bearish trend below their middle lines and short-term levels of resistance, such as around 4100, have become defined. As we have been explaining in our outlooks to subscribers over the past week, even before this headline shock attributed to the SVB Financial collapse, the risks that the financial sector is portraying for the broader market are significant and caution is warranted given the leading nature of banks for broader equity market performance. The large-cap benchmark finds itself back below its 200-day moving average, which, as explained in our last outlook, nothing good happens while prices are below. The concerning technical and fundamental backdrop must be weighed against what is typically a strong timeframe for stocks through the month of April, but when we have something tangible in hand to suggest something abnormal is occurring, whether it be a pandemic closure of the economy or an elevation of systematic risks in the banking sector, we have to abandon traditional seasonal biases.
Sentiment on Friday, as gauged by the put-call ratio, ended bearish at 1.25.Today, in our Market Outlook to subscribers, we discuss the following:
Subscribers can look for this report in their inbox or by clicking on the following link and logging in: Market Outlook for March 13 Not signed up yet? Subscribe now to receive full access to all of the research and analysis that we publish.
- Weekly look at the large-cap benchmark
- The jump in treasury bond prices
- The action that we are taking in the Super Simple Seasonal Portfolio
- US Dollar Index struggling at the 50-week moving average
- US Employment Situation
- Canada Labour Force Survey
- Investor sentiment and the jump in the VIX from significant horizontal support
 Seasonal charts of companies reporting earnings today:


S&P 500 Index


TSE Composite


| Sponsored By... |

|


