Stock Market Outlook for March 6, 2023

Real Time Economic Calendar provided by Investing.com.
*** Stocks highlighted are for information purposes only and should not be considered as advice to purchase or to sell mentioned securities. As always, the use of technical and fundamental analysis is encouraged in order to fine tune entry and exit points to average seasonal trends.
Stocks Entering Period of Seasonal Strength Today:
Subscribers – Click on the relevant link to view the full profile. Not a subscriber? Signup here.
Federal Signal Corp. (NYSE:FSS) Seasonal Chart

iShares Global Healthcare Index ETF (CAD-Hedged) (TSE:XHC.TO) Seasonal Chart

Invesco S&P SmallCap Consumer Staples ETF (NASD:PSCC) Seasonal Chart

Zymeworks Inc. (NYSE:ZYME) Seasonal Chart

Citigroup, Inc. (NYSE:C) Seasonal Chart

Pennsylvania REIT (NYSE:PEI) Seasonal Chart

John Wiley & Sons, Inc. (NYSE:WLY) Seasonal Chart
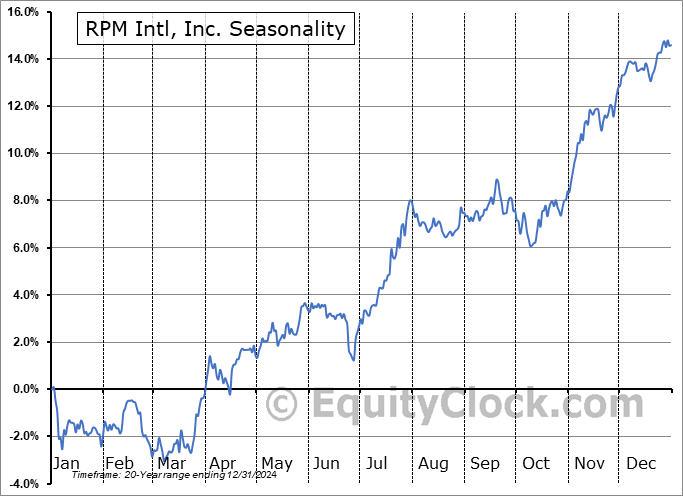
RPM Intl, Inc. (NYSE:RPM) Seasonal Chart
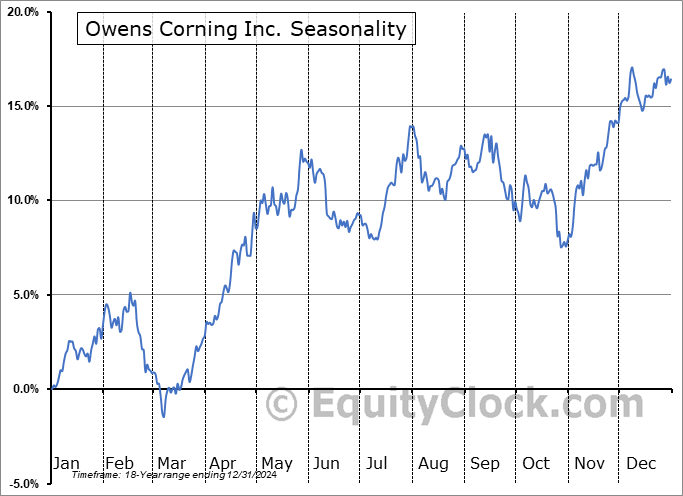
Owens Corning Inc. (NYSE:OC) Seasonal Chart

First Trust NASDAQ Cybersecurity ETF (NASD:CIBR) Seasonal Chart

MongoDB, Inc. (NASD:MDB) Seasonal Chart
The Markets
Stocks posted strong gains in the Friday session as major benchmarks bounced from levels of significant support. The S&P 500 Index followed through with Thursday’s outside reversal session to close higher by 1.61%, continuing to draw in buyers following the test of the 200-day moving average in the previous session. The benchmark has moved beyond the still rising 50-day moving average, reconfirming the intermediate rising path of higher-highs and higher-lows that has been intact since the lows charted in October. The next major test is the still declining 20-day moving average around 4060, but this is minor when taking into context that the intermediate and long-term moving averages at the 50 and 200-day are in positions to backstop this market. Momentum indicators are showing early signs of curling higher above the lows charted in December, continuing to present a rather neutral look to the benchmark that for the past five months has held predominantly within the six week span charted between the middle of August and the end of September in the range of 3600 to 4325. This is the span that we expect the benchmark to remain, even through the period of strength for stocks ahead, but this does not prevent us from looking to take on greater risk in the portfolio for the spring seasonal ramp in equity prices ahead. More on that below.
Sentiment on Friday, as gauged by the put-call ratio, ended bullish at 0.91.Today, in our Market Outlook to subscribers, we discuss the following:
Subscribers can look for this report in their inbox or by clicking on the following link and logging in: Market Outlook for March 6 Not signed up yet? Subscribe now to receive full access to all of the research and analysis that we publish.
- Bounce from support for the Dow Jones Industrial Average and the NASDAQ 100 (QQQ)
- Weekly look at the large-cap benchmark
- A look at coincident indicators of the economy to gauge near-term risks
- The collapse of bullish sentiment over the past month
- The change we are making in the Super Simple Seasonal Portfolio based on the seasonal, technical, fundamental, and sentiment backdrop
 Seasonal charts of companies reporting earnings today:


S&P 500 Index


TSE Composite


| Sponsored By... |

|


