Stock Market Outlook for February 22, 2023

Real Time Economic Calendar provided by Investing.com.
*** Stocks highlighted are for information purposes only and should not be considered as advice to purchase or to sell mentioned securities. As always, the use of technical and fundamental analysis is encouraged in order to fine tune entry and exit points to average seasonal trends.
Stocks Entering Period of Seasonal Strength Today:
Subscribers – Click on the relevant link to view the full profile. Not a subscriber? Signup here.
American Homes 4 Rent (NYSE:AMH) Seasonal Chart

Amphastar Pharmaceuticals, Inc. (NASD:AMPH) Seasonal Chart

iShares U.S. Telecommunications ETF (NYSE:IYZ) Seasonal Chart
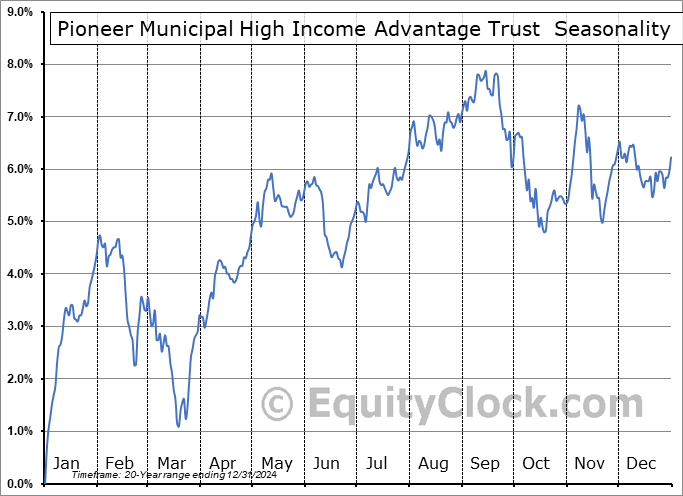
Pioneer Municipal High Income Advantage Trust (NYSE:MAV) Seasonal Chart
The Markets
Stocks sold off in the first session of the new week as a rate shock sent equity investors to the exits. The S&P 500 Index closed down by 2.00%, reaching down to psychological and rising trendline support at 4000. A cloud of moving averages is directly below in the range between 3900 to 4000, a zone that is viewed as a likely first stop in this near-term pullback. Momentum indicators remain on sell signals following bearish crossovers that were recorded a week ago Friday. Altogether, the price action is very much inline with what is average for the month of February when early month strength is typically offset by back-half weakness and the rate concerns ignited in recent weeks merely provides the catalyst to realize this normal pullback in what has historically become a month of rising volatility. Stocks typically reach a low around the start of March before the next seasonal upleg begins, carrying the market higher, on average, through the month of April, ahead of the contribution deadline for investment retirement accounts (IRAs).
Today, in our Market Outlook to subscribers, we discuss the following:
Subscribers can look for this report in their inbox or by clicking on the following link and logging in: Market Outlook for February 22 Not signed up yet? Subscribe now to receive full access to all of the research and analysis that we publish.
- The rise in the cost of borrowing and the risk to stocks
- The jump in the Volatility Index (VIX)
- Ratings changes in this week’s chart books
- US Existing Home Sales
Want to know which areas of the market to buy or sell? Our Weekly Chart Books have just been updated, providing a clear Accumulate, Avoid, or Neutral rating for currencies, cryptocurrencies, commodities, broad markets, and subsectors/industries of the market. Subscribers can login and click on the relevant links to access.Sentiment on Tuesday, as gauged by the put-call ratio, ended bearish at 1.05.
- Currencies
- Cryptocurrencies
- Commodities
- Major Benchmarks
- Sub-sectors / Industries
- ETFs: Bonds | Commodities | Equity Markets | Industries | Sectors
Subscribe now.
 Seasonal charts of companies reporting earnings today:

 Seasonal Chart")


 Seasonal Chart")


S&P 500 Index


TSE Composite


| Sponsored By... |

|


