Stock Market Outlook for February 21, 2023

Real Time Economic Calendar provided by Investing.com.
*** Stocks highlighted are for information purposes only and should not be considered as advice to purchase or to sell mentioned securities. As always, the use of technical and fundamental analysis is encouraged in order to fine tune entry and exit points to average seasonal trends.
Stocks Entering Period of Seasonal Strength Today:
Subscribers – Click on the relevant link to view the full profile. Not a subscriber? Signup here.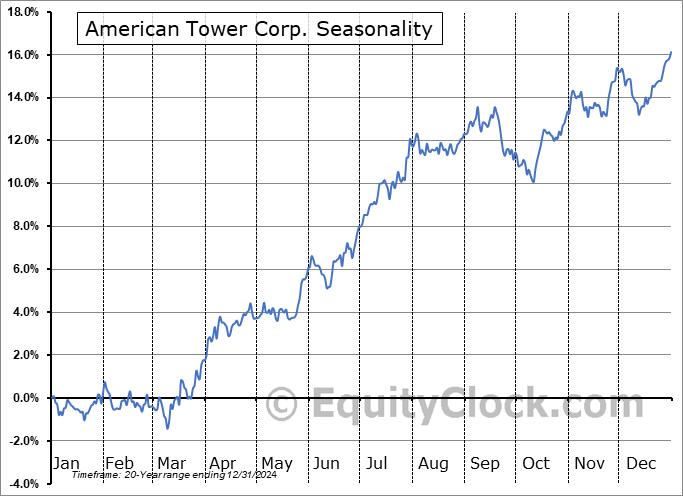
American Tower Corp. (NYSE:AMT) Seasonal Chart

Southwestern Energy Co. (NYSE:SWN) Seasonal Chart

George Weston Ltd. (TSE:WN.TO) Seasonal Chart

Crown Castle Intl Corp. (NYSE:CCI) Seasonal Chart

Avis Budget Group, Inc. (NASD:CAR) Seasonal Chart

Novartis A G (NYSE:NVS) Seasonal Chart

Waste Connections, Inc. (NYSE:WCN) Seasonal Chart

Vanguard Intermediate-Term Corporate Bond ETF (NASD:VCIT) Seasonal Chart

Savaria Corp. (TSE:SIS.TO) Seasonal Chart

iShares Convertible Bond Index ETF (TSE:CVD.TO) Seasonal Chart
The Markets
Stocks closed generally lower on Friday as investors weigh the risk of further rate hikes against the better than expected economic datapoints for the month of January. The S&P 500 Index closed down by just less than three-tenths of one percent, ending below the rising 20-day moving average for the first time since the start of January as the short-term path of the benchmark starts to show tangible signs of struggle. Momentum indicators for the large-cap benchmark remain on a sell signal following the prior week’s bearish crossover of MACD below its signal line, highlighting the waning buying demand for stocks around the pivotal 4100 level. A neutral view of the trajectory of this important gauge of stocks remains appropriate as we progress through what is typically a weaker time of year for risk through the month of February. The S&P 500 Index tends to decline between now and the start of March and signs of a short-term topping pattern gives the bias toward the fulfilment of this seasonal pattern before the sustained period of strength for stocks begins in March. Major moving averages between 3900 and 4000 remain in a position to catch the benchmark upon a retracement lower and the catalyst to shift from a neutral viewpoint on the technical front would materialize should the aforementioned span break.
Sentiment on Friday, as gauged by the put-call ratio, ended bearish at 1.07.Today, in our Market Outlook to subscribers, we discuss the following:
Subscribers can look for this report in their inbox or by clicking on the following link and logging in: Market Outlook for February 21 Not signed up yet? Subscribe now to receive full access to all of the research and analysis that we publish.
- Weekly look at the large-cap benchmark
- A shift towards risk aversion
- The “yo-yo” pattern for the price of oil and the fundamental backdrop to the commodity
- Energy sector ETFs
- Consumer loan activity in January
- The rise of delinquencies
 Seasonal charts of companies reporting earnings today:
 Seasonal Chart")


 Seasonal Chart")

 Seasonal Chart")


S&P 500 Index


TSE Composite


| Sponsored By... |

|


