Stock Market Outlook for February 13, 2023

*** Stocks highlighted are for information purposes only and should not be considered as advice to purchase or to sell mentioned securities. As always, the use of technical and fundamental analysis is encouraged in order to fine tune entry and exit points to average seasonal trends.
Stocks Entering Period of Seasonal Strength Today:
Subscribers – Click on the relevant link to view the full profile. Not a subscriber? Signup here.
Vanguard Total World Stock ETF (NYSE:VT) Seasonal Chart
SBA Communications Corp. (NASD:SBAC) Seasonal Chart
Invesco S&P Global Water Index ETF (NYSE:CGW) Seasonal Chart
Quanta Services, Inc. (NYSE:PWR) Seasonal Chart
Masonite Intl Corp. (NYSE:DOOR) Seasonal Chart
EXACT Sciences Corp. (NASD:EXAS) Seasonal Chart
Pearson PLC (NYSE:PSO) Seasonal Chart
Prestige Consumer Healthcare Inc. (NYSE:PBH) Seasonal Chart
Xcel Energy (NASD:XEL) Seasonal Chart
The Markets
Stocks closed mixed to end the trading week as investors continue to consolidate the gains of the past month and position ahead of the release of the next inflation gauge by way of the report on consumer prices on Tuesday. The S&P 500 Index closed with a gain of just over two-tenths of one percent, supported by strength in energy and a rebound in utilities. The benchmark remains below the important pivot point at 4100, representing horizontal resistance at the December highs, but support at the cloud of major moving averages below is starting to be realized with Friday’s test of the rising 20-day moving average. The 50, 100, 150, and 200-day moving averages remain predominantly within a range between 3900 and 4000, presenting a massive range of support that is able to catch this market should this week’s pullback continue through the end of the month. The zone also aligns with rising trendline support that stems from the October low, presenting a hurdle that is attempting to define the path of the market for the remainder of the year. For now, while we remain around this confluence of support, still battling with the 4100 level of resistance derived by the December highs, a neutral view of the broad market benchmark remains warranted, but this does not prevent us from taking directional bets in various segments that are performing well (eg. energy), while avoiding exposure to those segments that are acting as a drag to broad equity market performance (see our weekly chart books for further insight and ideas).
Today, in our Market Outlook to subscribers, we discuss the following:
- Weekly look at the large-cap benchmark
- The rejection of cryptocurrencies at resistance around their declining 50-week moving average
- Canada Labour Force Survey
- Canadian Dollar
- Consumer Credit
Subscribers can look for this report in their inbox or by clicking on the following link and logging in: Market Outlook for February 13
Not signed up yet? Subscribe now to receive full access to all of the research and analysis that we publish.
Sentiment on Friday, as gauged by the put-call ratio, ended bearish at 1.05.
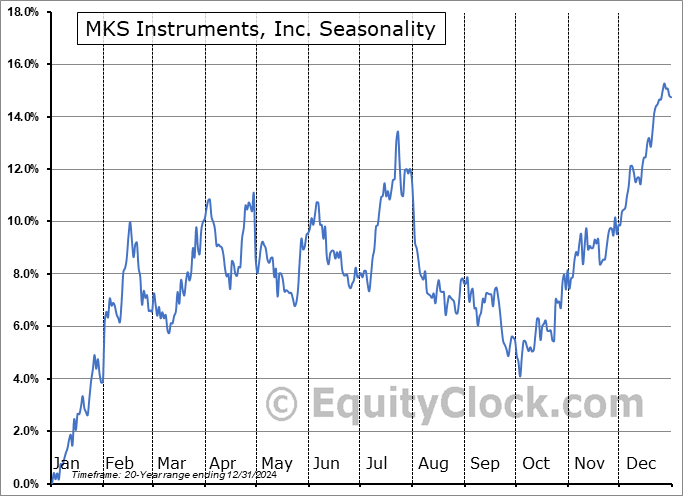
Seasonal charts of companies reporting earnings today:
S&P 500 Index
TSE Composite
| Sponsored By... |

|


