Stock Market Outlook for February 6, 2023

Real Time Economic Calendar provided by Investing.com.
*** Stocks highlighted are for information purposes only and should not be considered as advice to purchase or to sell mentioned securities. As always, the use of technical and fundamental analysis is encouraged in order to fine tune entry and exit points to average seasonal trends.
Stocks Entering Period of Seasonal Strength Today:
Subscribers – Click on the relevant link to view the full profile. Not a subscriber? Signup here.
HanesBrands, Inc. (NYSE:HBI) Seasonal Chart

Roper Technologies, Inc. (NYSE:ROP) Seasonal Chart
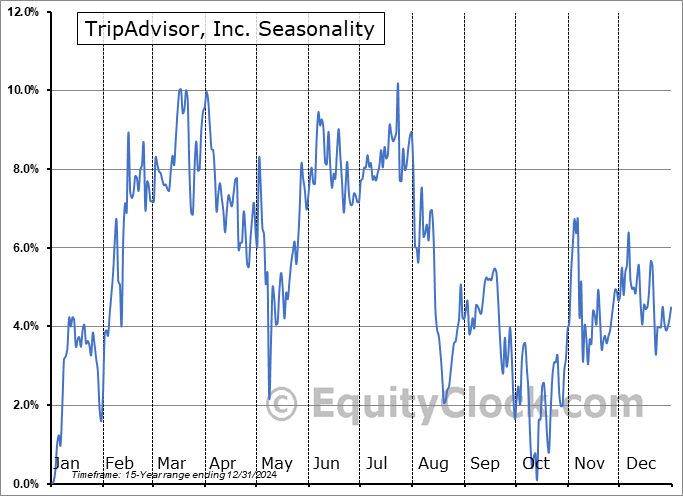
TripAdvisor, Inc. (NASD:TRIP) Seasonal Chart

Carter Holdings Inc. (NYSE:CRI) Seasonal Chart

Steven Madden, Ltd. (NASD:SHOO) Seasonal Chart

Franco-Nevada Corp. (NYSE:FNV) Seasonal Chart

TreeHouse Foods Inc. (NYSE:THS) Seasonal Chart
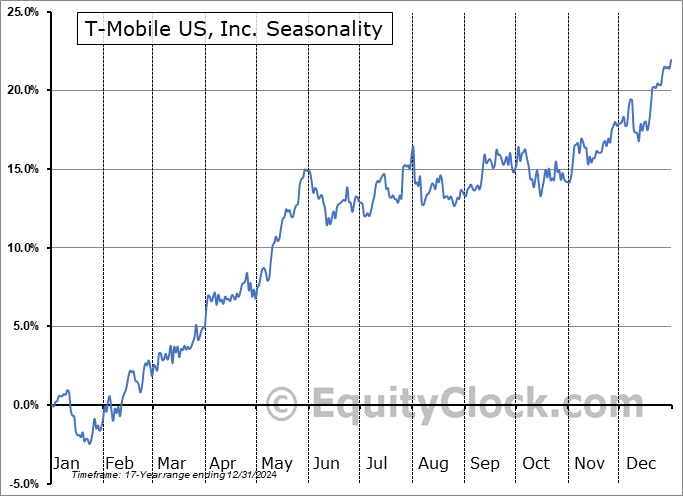
T-Mobile US, Inc. (NASD:TMUS) Seasonal Chart

Invesco DWA Consumer Staples Momentum ETF (NASD:PSL) Seasonal Chart

Vanguard Consumer Staples ETF (NYSE:VDC) Seasonal Chart

CI WisdomTree International Qlty Divi Growth Index ETF (TSE:IQD.TO) Seasonal Chart
The Markets
Stocks slipped on Friday as a much stronger than expected report of payrolls reignited concerns that the Fed will be forced to continue hiking rates for the foreseeable future. The S&P 500 Index closed with a loss of 1.04%, pulling back towards recently broken horizontal resistance at 4100. A convergence of moving averages between 3900 and 4000, approximately bookending recently broken declining resistance, defines a point of support below this market as it seeks to build on the breakout that has been recorded over the past couple of weeks. Momentum indicators are moving past the narrowing, neutral bound that they have been in for the past few months and overbought territory is being flirted with. While the breakouts could pull in sidelined cash given hints of the shift of trajectory upon us, in our work, the more enticing opportunity to become outright accumulators of domestic equities over a sustainable timeframe is when a path of higher-highs and higher lows, supported by 50-week moving averages, becomes defined. We are merely in stage one of this shift and the risk-reward is not providing much incentive to lean towards the bull or bear camp. For now, a neutral bias remains desired, but there are still plenty of areas where we can take more of a directional bet, either bullish or bearish (see our weekly chart books for further insight).
Sentiment on Friday, as gauged by the put-call ratio, ended bullish at 0.91.Today, in our Market Outlook to subscribers, we discuss the following:
Subscribers can look for this report in their inbox or by clicking on the following link and logging in: Market Outlook for February 4 Not signed up yet? Subscribe now to receive full access to all of the research and analysis that we publish.
- Weekly look at the large-cap benchmark
- US Employment Situation
- The jump in the US Dollar and the downfall of commodity prices
- The state of demand in the energy market
- Contrasting the relative performance of energy over metals (gold/silver)
 Seasonal charts of companies reporting earnings today:


 Seasonal Chart")


S&P 500 Index


TSE Composite


| Sponsored By... |

|


