Stock Market Outlook for February 2, 2023

*** Stocks highlighted are for information purposes only and should not be considered as advice to purchase or to sell mentioned securities. As always, the use of technical and fundamental analysis is encouraged in order to fine tune entry and exit points to average seasonal trends.
Stocks Entering Period of Seasonal Strength Today:
Subscribers – Click on the relevant link to view the full profile. Not a subscriber? Signup here.
Anterix Inc. (NASD:ATEX) Seasonal Chart
Bit Brother Limited (NASD:BTB) Seasonal Chart
Chemours Co. (NYSE:CC) Seasonal Chart
United States 12 Month Oil Fund, LP (NYSE:USL) Seasonal Chart
SPDR S&P Emerging Asia Pacific ETF (NYSE:GMF) Seasonal Chart
Baytex Energy Corp. (TSE:BTE.TO) Seasonal Chart
Prudential PLC (NYSE:PUK) Seasonal Chart
Cirrus Logic, Inc. (NASD:CRUS) Seasonal Chart
The Markets
Stocks jumped on Wednesday as the latest FOMC announcement gave a jolt to the the market to allow it to violate levels of resistance overhead. The S&P 500 Index closed with a gain of 1.05%, moving marginally above the important 4100 level that had acted as a short-term double-top through the month of December. A long-upper wick candlestick above this hurdle, however, left some room for the bears to argue that upside exhaustion around this important hurdle fails to provide the definitive breakout that would be required to start to shift from a neutral bias that had been warranted in recent months. Momentum indicators moved higher, keeping the buy signal that was triggered with respect to MACD at the start of January intact for the time-being. The 50-day moving average is about a session away from crossing above its 200-day moving average, an event that will receive much chatter if and when realized. While the reflux reaction to the FOMC event is producing some encouraging technical signals, the more telling reaction to the fundamental event is typically realized in the days following and with many significant earnings reports scheduled before the week comes to a close, there is still much to keep this market on its toes.
Today, in our Market Outlook to subscribers, we discuss the following:
- Treasury bond ETFs moving above their 200-day moving averages for the first time in over a year
- Job Openings and Labor Turnover Survey (JOLTS)
- US Construction Spending
- Our seasonal trade in the construction stocks/home builders
Subscribers can look for this report in their inbox or by clicking on the following link and logging in: Market Outlook for February 2
Not signed up yet? Subscribe now to receive full access to all of the research and analysis that we publish.
Just Released…
Our 92-page monthly report for February is out, providing everything that you need to know for the month(s) ahead.
Highlights in this report include:
- Equity market tendencies in the month of February
- Investors not upbeat about the year ahead
- Using the Yield Curve as a coincident indicator to a recessionary market decline
- Analysts are too optimistic and this is good news for the bond market
- Credit spreads providing indication of alleviating strains, but a recession would certainly change that
- The ultimate coincident indication of economic activity: Jobless Claims
- Market versus the Fed
- Consumer has definitively cashed out
- Existing Home Sales
- Manufacturers not optimistic either
- Tightening lending standards
- Not helping industrials is the downfall of the shipping economy
- Inflationary pressures remain an ongoing concern and could re-flare through the months ahead
- Forecasted general direction of stocks in 2023
- Dow Jones Industrial Average and NYSE Composite back to the 2022 breakdown points
- Sustainability of this year’s strength of domestic equities in question
- Dollar remains key to the market
- Bonds
- Lower yields versus a stronger dollar
- If you can’t find any love at home, go elsewhere
- Strength in International equities correlates well with strength in Gold
- Our list of all segments of the market to either Accumulate or Avoid, along with relevant ETFs
- Positioning for the months ahead
- Sector Reviews and Ratings
- Stocks that have Frequently Gained in the Month of February
- Notable Stocks and ETFs Entering their Period of Strength in February
Subscribers can look for this report in their inbox or via the report archive at https://charts.equityclock.com/.
Not subscribed yet? Signup now to receive this and other reports that we publish on either a daily or monthly basis, providing insight on how to position your portfolio according to our three pronged approach.
With the new month upon us and as we celebrate the release of our monthly report for February, today we release our screen of all of the stocks that have gained in every February over their trading history. While we at Equity Clock focus on a three-pronged approach (seasonal, technical, and fundamental analysis) to gain exposure to areas of the market that typically perform well over intermediate (2 to 6 months) timeframes, we know that stocks that have a 100% frequency of success for a particular month is generally of interest to those pursuing a seasonal investment strategy. Below are the results:
And how about those securities that have never gained in this second month of the year, here they are:
*Note: None of the results highlighted above have the 20 years of data that we like to see in order to accurately gauge the annual recurring, seasonal influences impacting an investment, therefore the reliability of the results should be questioned. We present the above list as an example of how our downloadable spreadsheet available to yearly subscribers can be filtered.
Sentiment on Wednesday, as gauged by the put-call ratio, ended bullish at 0.90.
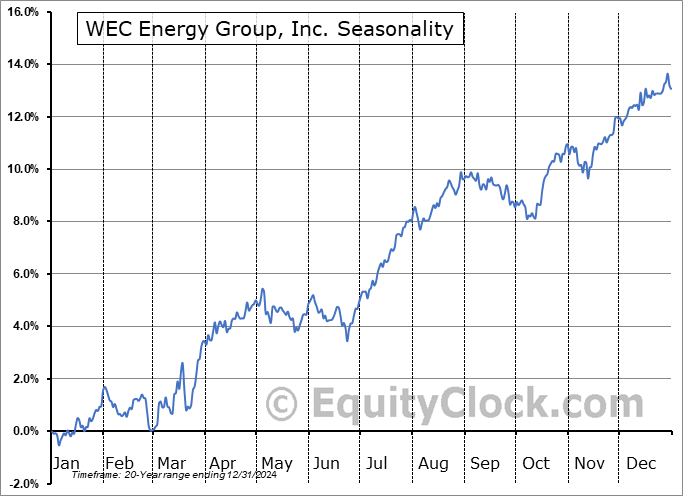
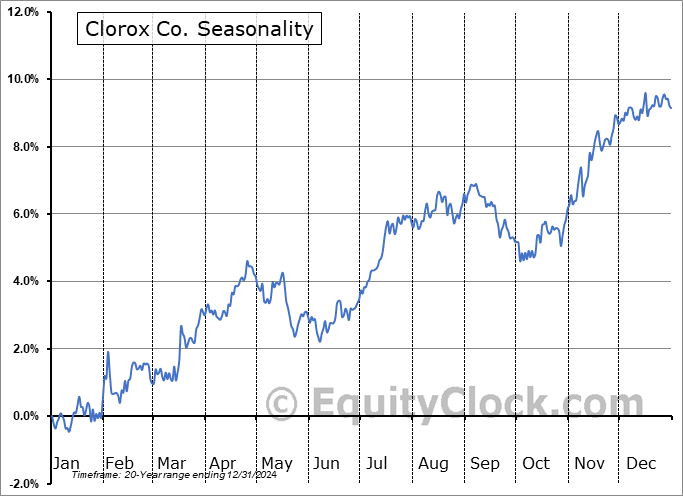
Seasonal charts of companies reporting earnings today:
S&P 500 Index
TSE Composite
| Sponsored By... |

|


