Stock Market Outlook for January 27, 2023

Real Time Economic Calendar provided by Investing.com.
*** Stocks highlighted are for information purposes only and should not be considered as advice to purchase or to sell mentioned securities. As always, the use of technical and fundamental analysis is encouraged in order to fine tune entry and exit points to average seasonal trends.
Stocks Entering Period of Seasonal Strength Today:
Subscribers – Click on the relevant link to view the full profile. Not a subscriber? Signup here.
American Express Co. (NYSE:AXP) Seasonal Chart

Aptargroup, Inc. (NYSE:ATR) Seasonal Chart

Brown & Brown Inc. (NYSE:BRO) Seasonal Chart

Olin Corp. (NYSE:OLN) Seasonal Chart

FleetCor Technologies Inc. (NYSE:FLT) Seasonal Chart

Inspire 100 ETF (AMEX:BIBL) Seasonal Chart

Snap Inc. (NYSE:SNAP) Seasonal Chart

Estee Lauder Cos. (NYSE:EL) Seasonal Chart

Hasbro, Inc. (NASD:HAS) Seasonal Chart

Dollar Tree, Inc. (NASD:DLTR) Seasonal Chart
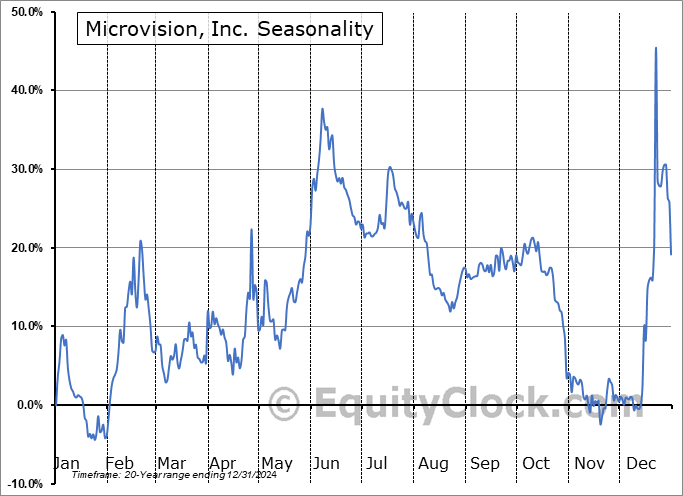
Microvision, Inc. (NASD:MVIS) Seasonal Chart

Horizon Therapeutics Public Ltd. Co. (NASD:HZNP) Seasonal Chart

Smith & Wesson Brands, Inc. (NASD:SWBI) Seasonal Chart
The Markets
Stocks rallied on Thursday as strength in the Consumer Discretionary and Energy sectors helped to lead the the continued unwind of the negative bias in the market. The S&P 500 Index closed with a gain of 1.10%, starting to move beyond the declining 200-day moving average in the most significant manner since March of last year. Declining trendline resistance has been violated and the next hurdle to watch is December’s short-term double-top at 4100, a level that if definitively violated would break intermediate trend of lower-highs that has been persistent since the start of last year. The 50-day moving average, indicative of the path of the intermediate-term trend, continues to point higher and is poised to cross above its declining 200-day moving average in the days ahead in an event that is known as a golden cross. While the technicals are such that a bearish bias is certainly not warranted, it is difficult to jump on the bull side either, leaving just a neutral view until either the bearish trend re-evolves or the bulls shift the prevailing declining path. Momentum indicators are converging around their middle lines, emphasizing a rather neutral bias.
Today, in our Market Outlook to subscribers, we discuss the following:
Subscribers can look for this report in their inbox or by clicking on the following link and logging in: Market Outlook for January 27 Not signed up yet? Subscribe now to receive full access to all of the research and analysis that we publish.
- S&P 500 Equal Weight Index inching above the neckline to a head-and-shoulders pattern
- Weekly Jobless Claims and the health of the labor market
- US Durable Goods Orders
- US New Home Sales
- US International Trade
Sentiment on Thursday, as gauged by the put-call ratio, ended bullish at 0.87.Mission Accomplished
January is always a busy month for us given all the of the updates that are required for our seasonal research, available via the chart database at https://charts.equityclock.com/. Our charts were updated just a few days into the new year, but our seasonal test that derives our optimal holding periods is a much more demanding process that takes many weeks to complete given the exhaustive nature of the study by testing each and every date combination to find periods of defined historical buying demand. We are pleased to announce that this process has been completed and the results have been uploaded to the database for your reference. Annual subscribers can also download the spreadsheet (https://charts.equityclock.com/download) that includes all of these results, providing a unique way to filter the data and perform your own queries right from your desktop. This exhaustive research is alone well worth the value of an annual subscription, however, if you are a monthly subscriber and have been with us for over a year, feel free to reach out to us to request access to this spreadsheet as well. Enjoy!
 Seasonal charts of companies reporting earnings today:


S&P 500 Index


TSE Composite


| Sponsored By... |

|


