Stock Market Outlook for January 24, 2023

*** Stocks highlighted are for information purposes only and should not be considered as advice to purchase or to sell mentioned securities. As always, the use of technical and fundamental analysis is encouraged in order to fine tune entry and exit points to average seasonal trends.
Stocks Entering Period of Seasonal Strength Today:
Subscribers – Click on the relevant link to view the full profile. Not a subscriber? Signup here.
VeriSign, Inc. (NASD:VRSN) Seasonal Chart
Crane Co. (NYSE:CR) Seasonal Chart
Western Union Co. (NYSE:WU) Seasonal Chart
Haynes International Inc. (NASD:HAYN) Seasonal Chart
Ligand Pharmaceuticals Inc. (NASD:LGND) Seasonal Chart
FreightCar America Inc. (NASD:RAIL) Seasonal Chart
Teekay Corp. (NYSE:TK) Seasonal Chart
Ericsson Telephone Co. (NASD:ERIC) Seasonal Chart
iShares Core High Dividend ETF (NYSE:HDV) Seasonal Chart
The Markets
Stocks strengthened to start the new week as investors continue to neutralize negative bets in portfolios given the uncertainty that surrounds earnings and the prospect of a pause in the rate hiking cycle following the next FOMC meeting. The S&P 500 Index closed with a gain of 1.19%, moving marginally above declining trendline resistance that has been threatening stocks for the past year. Support has been confirmed at the 20-day moving average following Friday’s bounce and the declining 200-day moving average is being surpassed. Momentum indicators continue to show a rather neutral look around their middle lines in what has become a rather uncertain look for US equities, overall. Lower-highs on RSI and MACD over the past five months are being offset by higher-lows in what, again, is a rather neutral looking chart. Seasonal tendencies suggest a softer period for equity market performance that runs through the month of February before strength lifts the tape through the spring, therefore there is not too much to be overly aggressive on in domestic risk assets (stocks) from a calendar year timing perspective and we can allow this neutral path to resolve before taking a bet, one way or the other. Fortunately, there are alternatives to domestic equities that are worthy to be invested in.
Today, in our Market Outlook to subscribers, we discuss the following:
- The long-term declining paths of the Technology and Consumer Discretionary ETFs
- The US Dollar
- Rejection of the Silver ETF from declining trendline resistance
- Rating changes in this week’s chart books: The one-word theme is Neutralization
Subscribers can look for this report in their inbox or by clicking on the following link and logging in: Market Outlook for January 24
Not signed up yet? Subscribe now to receive full access to all of the research and analysis that we publish.
Want to know which areas of the market to buy or sell? Our Weekly Chart Books have just been updated, providing a clear Accumulate, Avoid, or Neutral rating for currencies, cryptocurrencies, commodities, broad markets, and subsectors/industries of the market. Subscribers can login and click on the relevant links to access.
- Currencies
- Cryptocurrencies
- Commodities
- Major Benchmarks
- Sub-sectors / Industries
- ETFs: Bonds | Commodities | Equity Markets | Industries | Sectors
Subscribe now.
New Addition: We have finally released our much anticipated ETF Chart Books, providing the same Accumulate, Neutral, and Avoid ratings as those that you have come to rely on in our other reports. The addition helps to fill some of the gaps that existed in our chart books, primarily relating to the coverage of bond and international equity performance, two segments of the market that have emerged in recent weeks as enticing opportunities worthy to Accumulate. You can find the links to this new addition below or on the home page of the chart database (https://charts.equityclock.com/).
Sentiment on Monday, as gauged by the put-call ratio, ended slightly bullish at 0.90.
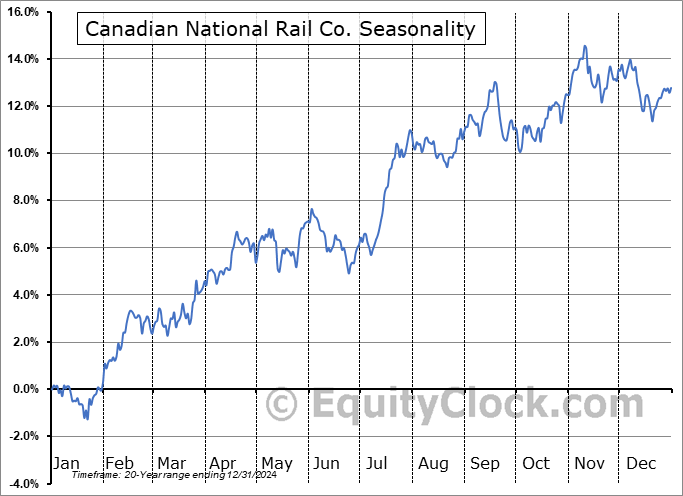
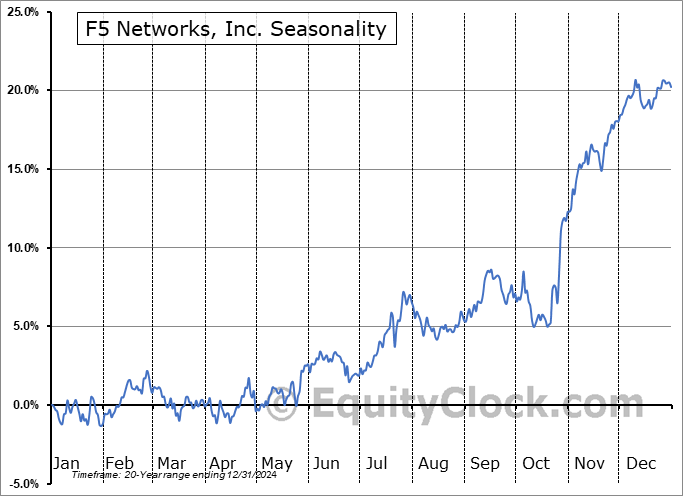
Seasonal charts of companies reporting earnings today:
S&P 500 Index
TSE Composite
| Sponsored By... |

|


