Stock Market Outlook for January 18, 2023

Real Time Economic Calendar provided by Investing.com.
*** Stocks highlighted are for information purposes only and should not be considered as advice to purchase or to sell mentioned securities. As always, the use of technical and fundamental analysis is encouraged in order to fine tune entry and exit points to average seasonal trends.
Stocks Entering Period of Seasonal Strength Today:
Subscribers – Click on the relevant link to view the full profile. Not a subscriber? Signup here.
M&T Bank Corp. (NYSE:MTB) Seasonal Chart

Oxford Industries Inc. (NYSE:OXM) Seasonal Chart

SLM Holding Corp. (NASD:SLM) Seasonal Chart
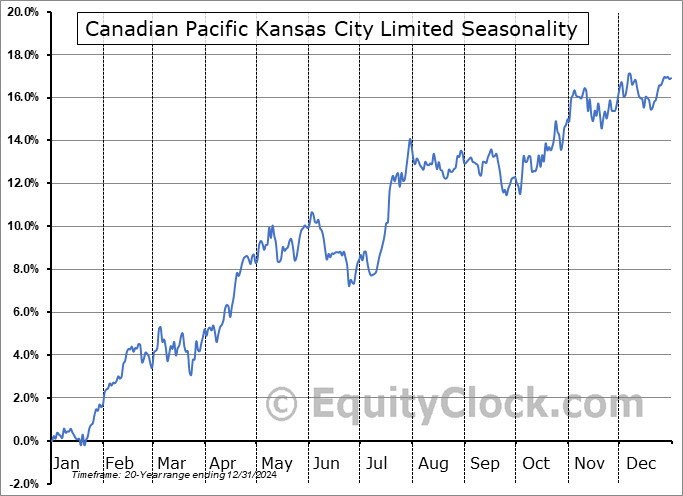
Canadian Pacific Railway (NYSE:CP) Seasonal Chart

Netflix, Inc. (NASD:NFLX) Seasonal Chart

Tenaris SA (NYSE:TS) Seasonal Chart

Communication Services Select Sector SPDR Fund (NYSE:XLC) Seasonal Chart

Absolute Software Corp. (NASD:ABST) Seasonal Chart
The Markets
Stocks closed mildly lower on Tuesday following the release of disappointing earnings from Dow component Goldman Sachs. The S&P 500 Index closed down by two-tenths of one percent, remaining below the highly scrutinized declining level of trendline resistance around 4000. Momentum indicators, while still pointed higher, are providing early signs of upside exhaustion as the market looks to take its cue based on which side of declining trendline resistance that the benchmark settles around as we progress through earnings season. The index remains supported at November’s upside gap between 3770 and 3860 and the intermediate 50-day moving average continues to point higher, suggestive of a positive intermediate path.
Today, in our Market Outlook to subscribers, we discuss the following:
Subscribers can look for this report in their inbox or by clicking on the following link and logging in: Market Outlook for January 18 Not signed up yet? Subscribe now to receive full access to all of the research and analysis that we publish.
- The downfall of manufacturer sentiment and the investment implications
- Break of trendline support for the US Dollar Index
- Ratings changes in this week chart books and the introduction of our new chart books for ETFs
- Investor sentiment
Want to know which areas of the market to buy or sell? Our Weekly Chart Books have just been updated, providing a clear Accumulate, Avoid, or Neutral rating for currencies, cryptocurrencies, commodities, broad markets, and subsectors/industries of the market. Subscribers can login and click on the relevant links to access.
- Currencies
- Cryptocurrencies
- Commodities
- Major Benchmarks
- Sub-sectors / Industries
- Bond ETFs *NEW*
- Commodity ETFs *NEW*
- Equity Market ETFs *NEW*
- Industry ETFs *NEW*
- Sector ETFs *NEW*
Subscribe now.
New Addition: We have finally released our much anticipated ETF Chart Books, providing the same Accumulate, Neutral, and Avoid ratings as those that you have come to rely on in our other reports. The addition helps to fill some of the gaps that existed in our chart books, primarily relating to the coverage of bond and international equity performance, two segments of the market that have emerged in recent weeks as enticing opportunities worthy to Accumulate. You can find the links to this new addition above or on the home page of the chart database (https://charts.equityclock.com/).Sentiment on Monday, as gauged by the put-call ratio, ended neutral at 1.00.
 Seasonal charts of companies reporting earnings today:


 Seasonal Chart")


S&P 500 Index


TSE Composite


| Sponsored By... |

|


