Stock Market Outlook for January 13, 2023

Real Time Economic Calendar provided by Investing.com.
*** Stocks highlighted are for information purposes only and should not be considered as advice to purchase or to sell mentioned securities. As always, the use of technical and fundamental analysis is encouraged in order to fine tune entry and exit points to average seasonal trends.
Stocks Entering Period of Seasonal Strength Today:
Subscribers – Click on the relevant link to view the full profile. Not a subscriber? Signup here.
PG&E Corp. (NYSE:PCG) Seasonal Chart
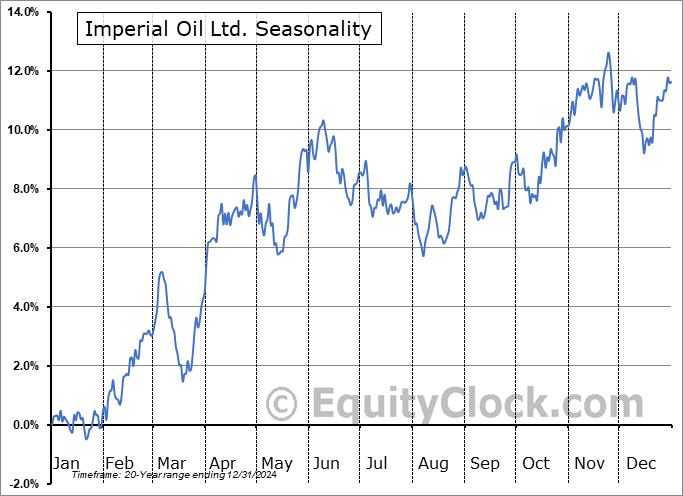
Imperial Oil Ltd. (TSE:IMO.TO) Seasonal Chart

Kirby Corp. (NYSE:KEX) Seasonal Chart

Howard Hughes Corp. (NYSE:HHC) Seasonal Chart

Ball Corp. (NYSE:BALL) Seasonal Chart

O’Reilly Automotive, Inc. (NASD:ORLY) Seasonal Chart

Pioneer Natural Resources Co. (NYSE:PXD) Seasonal Chart

Saputo Group, Inc. (TSE:SAP.TO) Seasonal Chart
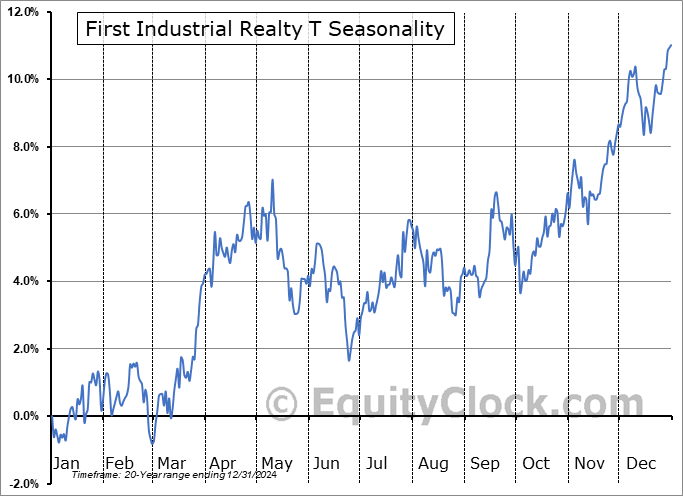
First Industrial Realty T (NYSE:FR) Seasonal Chart

Keurig Dr Pepper Inc. (NASD:KDP) Seasonal Chart

iShares S&P GSCI Commodity-Indexed Trust (NYSE:GSG) Seasonal Chart

Invesco S&P 500 Quality ETF (AMEX:SPHQ) Seasonal Chart
The Markets
Stocks closed higher on Thursday as investors interpreted the softening of inflationary pressures as reason for the Fed to step back from its aggressive tightening path. The S&P 500 Index gained a third of one percent, reaching back to and intersecting with declining trendline resistance and the 200-day moving average at 4,000. This is a make or break point for the path of the intermediate to long-term trend and investor reaction to this zone will be heavily scrutinized. Momentum indicators remain on an upswing following Friday’s bullish crossover of MACD and its signal line and they are now pushing into the upper half of their ranges, attempting to relinquish characteristics of a bearish trend that had been observed through the past few weeks. The large-cap benchmark is flirting with short-term overbought territory, which, barring some upside catalyst, could cap the price action in the near-term until greater clarity of the health of the fundamentals of stocks are obtained from the upcoming earnings season that gets underway with the big banks on Friday. Seasonally, the big banks, including JPM, BAC, and WFC, tend to trade lower, on average, following the release of fourth quarter results.
Sentiment on Thursday, as gauged by the put-call ratio, ended close to neutral at 0.97.Today, in our Market Outlook to subscribers, we discuss the following:
Subscribers can look for this report in their inbox or by clicking on the following link and logging in: Market Outlook for January 13 Not signed up yet? Subscribe now to receive full access to all of the research and analysis that we publish.
- The Volatility Index (VIX)
- Weekly Jobless Claims and the health of the labor market
- The abnormal January increase in Natural Gas stockpiles
- US Consumer Price Index (CPI)
 Seasonal charts of companies reporting earnings today:


S&P 500 Index


TSE Composite


| Sponsored By... |

|


