Stock Market Outlook for January 4, 2023

Real Time Economic Calendar provided by Investing.com.
*** Stocks highlighted are for information purposes only and should not be considered as advice to purchase or to sell mentioned securities. As always, the use of technical and fundamental analysis is encouraged in order to fine tune entry and exit points to average seasonal trends.
Stocks Entering Period of Seasonal Strength Today:
Subscribers – Click on the relevant link to view the full profile. Not a subscriber? Signup here.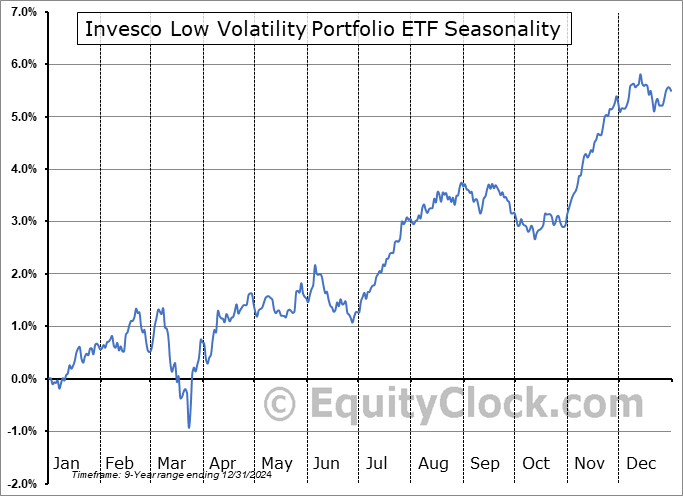
Invesco Low Volatility Portfolio ETF (TSE:PLV.TO) Seasonal Chart

Invesco Defensive Equity ETF (NYSE:DEF) Seasonal Chart

Nuveen Municipal Income Fund, Inc. (NYSE:NMI) Seasonal Chart

Invesco S&P 500 Pure Growth ETF (NYSE:RPG) Seasonal Chart

Schwab US Aggregate Bond ETF (NYSE:SCHZ) Seasonal Chart

Vanguard Consumer Discretionary ETF (NYSE:VCR) Seasonal Chart

Invesco DWA Consumer Cyclicals Momentum ETF (NASD:PEZ) Seasonal Chart

ProShares VIX Short-Term Futures ETF (NYSE:VIXY) Seasonal Chart

Universal Health Services – Class B (NYSE:UHS) Seasonal Chart

BMO Equal Weight REITs Index ETF (TSE:ZRE.TO) Seasonal Chart

Zumiez Inc. (NASD:ZUMZ) Seasonal Chart

Sun Communities, Inc. (NYSE:SUI) Seasonal Chart

Stericycle, Inc. (NASD:SRCL) Seasonal Chart

Invesco S&P/TSX Composite Low Volatility Index ETF (TSE:TLV.TO) Seasonal Chart
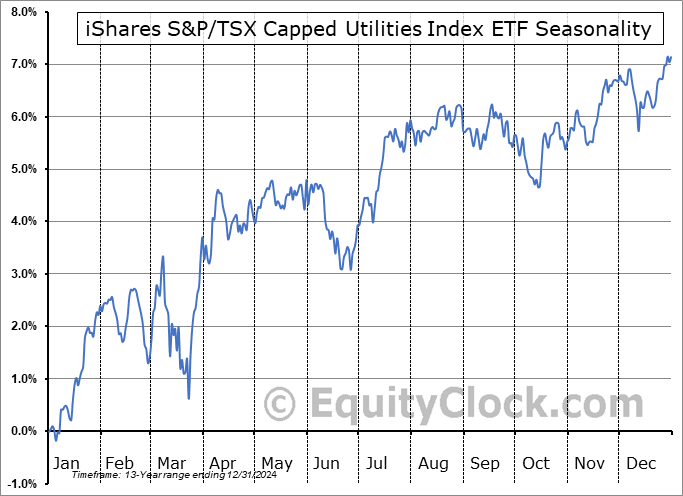
iShares S&P/TSX Capped Utilities Index ETF (TSE:XUT.TO) Seasonal Chart
The Markets
Stocks struggled in the first session of the new year as strength in the US Dollar and weakness in two market heavyweights, Apple and Tesla, dragged on the broader market. The S&P 500 Index closed down by four-tenths of one percent, charting a rather indecisive doji candlestick pattern within the recent consolidation range below the 50-day moving average and horizontal resistance at 3900. The aforementioned hurdles overhead remain vital pivot points for the market to overcome to allow a bullish resolution to play out, in absence of which the path of least resistance is lower, aligned with long-term declining trendline resistance just above 4000. Momentum indicators on the daily chart are still showing signs of near-term downside exhaustion as MACD converges back on its signal line and RSI stabilizes. Depending on your view of the span of the Santa Claus rally period, you are either looking for the positivity attributed to this timeframe to wane after today or after the end of this week (January 6th), following which weakness in the market, particularly core cyclical bets, is the norm. Excessively bearish sentiment continues to stand in the way of the sustainability of the declining trend of stocks that began a year ago, but the fundamentals have us poised to enter into recession at some point in the year ahead, an event that typically fuels a sustainable declining path for stocks.
Today, in our Market Outlook to subscribers, we discuss the following:
Subscribers can look for this report in their inbox or by clicking on the following link and logging in: Market Outlook for January 4 Not signed up yet? Subscribe now to receive full access to all of the research and analysis that we publish.
- Markets looking for a catalyst to break the recent consolidation range in stocks
- US Dollar Index bouncing from significant support
- Treasury bond prices bouncing from their 50-day moving averages and the change being enacted in the Super Simple Seasonal Portfolio
- Decline in treasury yields alongside the decline in stock prices amidst the rise of the US Dollar normal at the start of a recessionary downturn
- Ratings changes in this week’s chart books: Find out what we have upgraded to Accumulate this week, along with our complete list of every segment of the market to either Accumulate or Avoid
Want to know which areas of the market to buy or sell? Our Weekly Chart Books have just been updated, providing a clear Accumulate, Avoid, or Neutral rating for currencies, cryptocurrencies, commodities, broad markets, and subsectors/industries of the market. Subscribers can login and click on the relevant links to access.Sentiment on Tuesday, as gauged by the put-call ratio, ended neutral at 0.99.Subscribe now.
 Seasonal charts of companies reporting earnings today:


S&P 500 Index


TSE Composite


| Sponsored By... |

|


