Stock Market Outlook for January 3, 2023

Real Time Economic Calendar provided by Investing.com.
*** Stocks highlighted are for information purposes only and should not be considered as advice to purchase or to sell mentioned securities. As always, the use of technical and fundamental analysis is encouraged in order to fine tune entry and exit points to average seasonal trends.
Stocks Entering Period of Seasonal Strength Today:
Subscribers – Click on the relevant link to view the full profile. Not a subscriber? Signup here.
Domino’s Pizza Group LTD (NYSE:DPZ) Seasonal Chart

Watsco, Inc. (NYSE:WSO) Seasonal Chart

Invesco Tactical Bond ETF (TSE:PTB.TO) Seasonal Chart

iShares 7-10 Year Treasury Bond ETF (NASD:IEF) Seasonal Chart

Absolute Software Corp. (TSE:ABST.TO) Seasonal Chart

ProShares Short Financials (NYSE:SEF) Seasonal Chart

Laboratory Corporation of America Holdings (NYSE:LH) Seasonal Chart
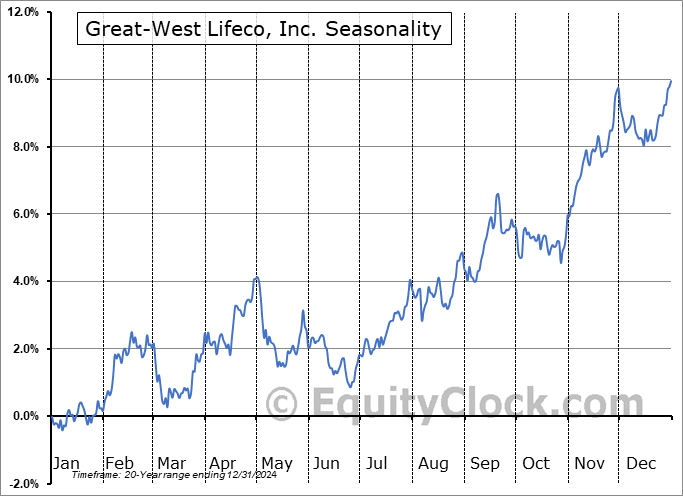
Great-West Lifeco, Inc. (TSE:GWO.TO) Seasonal Chart

Noodles & Company (NASD:NDLS) Seasonal Chart
The Markets
Stocks struggled in the final session of 2022, providing a fitting close to what has been a disappointing year for equity investments, overall. The S&P 500 Index closed with a loss of a quarter of one percent, remaining within the consolidation range that has been carved out over the past couple of weeks just below the 50-day moving average and horizontal resistance at 3900. Momentum indicators continue to show signs of short-term downside exhaustion as MACD once again converges on its signal line. It was on December 6th that MACD generated a sell signal by crossing below its signal line. The 20-day moving average continues to curl lower, defining a negative trend on a short-term timescale, however, the 50-day moving average, more indicative of the path of the intermediate trend, is still pointed higher. The two moving averages are converging on one another at aforementioned horizontal resistance at 3900. November’s upside gap support between 3770 and 3860 has done an effective job keeping the large-cap benchmark stable during this seasonally strong time of year, but we have yet to observe upside follow-through more aligned with might be expected of this holiday influenced timeframe. There is still a few more days left in the Santa Claus Rally period, but the timeframe is becoming limited.
For the month ahead, over the past two decades, the first month of the year has averaged a decline of 0.3% with only 45% of periods showing a gain. Returns range from a loss of 8.6% in January 2009 to a gain of 7.9% in January of 2019. We breakdown everything to look out for in the month ahead in our just released monthly outlook for January. Look for this report in your inbox now.Today, in our Market Outlook to subscribers, we discuss the following:
Subscribers can look for this report in their inbox or by clicking on the following link and logging in: Market Outlook for January 3 Not signed up yet? Subscribe now to receive full access to all of the research and analysis that we publish.
- A look at the predictive power of the Santa Claus rally on the subsequent calendar year return for stocks should the period end in failure
- Monthly look at the S&P 500 Index
- Reviewing and commenting on a major theme in our January report
- Securities that have either gained or lost in every January over their trading history


Sentiment on Friday, as gauged by the put-call ratio, ended bearish at 1.19.Just released…
Our monthly report for January is out, providing our forecast for stocks, bonds, commodities, and currency market for the year ahead, as well as providing everything that you need to know to navigate through the month(s) ahead according to our three pronged approach. Highlights in this report include:Subscribers can look for this report in their inbox or via the report archive at the following link: https://charts.equityclock.com Not subscribed yet? Signup now to receive a copy of this report and obtain access to all of the research that we publish on a daily, weekly, and monthly basis.
- Equity market tendencies in the month of January
- Our Base-Case for 2023
- Average performance of stocks during recessionary years
- Using the path of the market during the 1981/82 recession as a guide for stocks moving forward
- Average performance of Gold during recessionary years
- Currency Market Forecast
- Looking for the return of the diversification benefits of a 60/40 Portfolio
- Inversion of the yield curve
- Inflationary pressures showing no significant signs of alleviating
- Tracking the spread of COVID
- Medical devices for offensive exposure in 2023
- Poor Breadth
- Breakdown of the Consumer Discretionary sector
- Banks struggling following their optimal holding period
- Price action of Copper foretelling of tough economic conditions ahead
- Crypto market a cause for concern
- Our list of all segments of the market to either Accumulate or Avoid, along with relevant ETFs
- Positioning for the months ahead
- Sector Reviews and Ratings
- Stocks that have Frequently Gained in the Month of January
- Notable Stocks and ETFs Entering their Period of Strength in January
 Seasonal charts of companies reporting earnings today:


S&P 500 Index


TSE Composite


| Sponsored By... |

|


