Stock Market Outlook for December 30, 2022

Real Time Economic Calendar provided by Investing.com.
*** Stocks highlighted are for information purposes only and should not be considered as advice to purchase or to sell mentioned securities. As always, the use of technical and fundamental analysis is encouraged in order to fine tune entry and exit points to average seasonal trends.
Stocks Entering Period of Seasonal Strength Today:
Subscribers – Click on the relevant link to view the full profile. Not a subscriber? Signup here.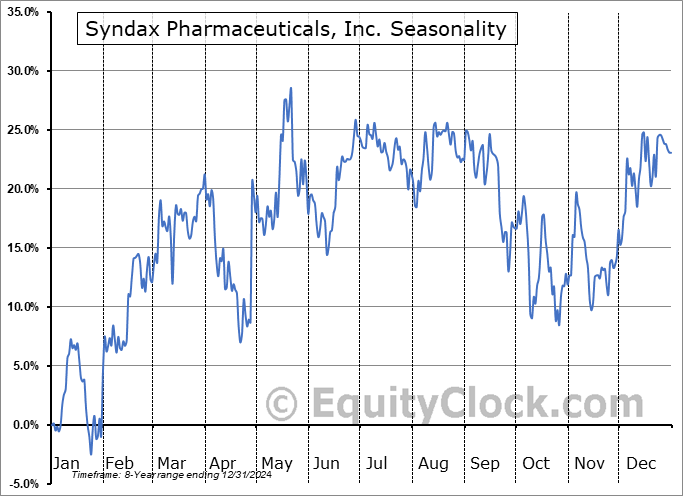
Syndax Pharmaceuticals, Inc. (NASD:SNDX) Seasonal Chart

Farmland Partners Inc. (NYSE:FPI) Seasonal Chart

Golden Ocean Group Limited (NASD:GOGL) Seasonal Chart

Ruths Chris Steak House Inc. (NASD:RUTH) Seasonal Chart

Northrop Grumman Corp. (NYSE:NOC) Seasonal Chart

Credit Suisse High Yield Bond Fund (AMEX:DHY) Seasonal Chart

Weibo Corp. (NASD:WB) Seasonal Chart

CASI Pharmaceuticals, Inc. (NASD:CASI) Seasonal Chart
The Markets
Stocks rebounded from Wednesday’s selloff as investors attempt to keep the prospect of a successful Santa Claus rally period alive now that end of year tax loss selling/portfolio rebalancing/window dressing has been largely completed with just one session left in the year. The S&P 500 Index closed with a gain of 1.75%, remaining within a consolidation range below the 50-day moving average and horizontal resistance at 3900. While a bear-flag pattern remains apparent on the chart, evidence of waning short-term downside momentum can be picked out as the benchmark holds support at November’s upside open gap between 3770 and 3860. Major moving averages continue to converge on the pivotal 3900, increasing the market’s sensitivity to this hurdle. Another week remains in this so-called Santa Claus rally period and we still cannot count out this favourable end of year gyration from realizing success, despite the discouraging technical path of the benchmark and fundamentals that give little reason for optimism heading into the new year.
Sentiment on Thursday, as gauged by the put-call ratio, ended overly bearish at 1.26.Today, in our Market Outlook to subscribers, we discuss the following:
Subscribers can look for this report in their inbox or by clicking on the following link and logging in: Market Outlook for December 30 Not signed up yet? Subscribe now to receive full access to all of the research and analysis that we publish.
- A closer look at the short-term trend of the equity market
- The evolving path of investor sentiment
- Weekly Jobless Claims and the health of the labor market
- Weekly Petroleum Status and the seasonal trade in oil
- An update on the trend of respiratory illnesses in the US
 Seasonal charts of companies reporting earnings today:
- No significant earnings scheduled for today.
S&P 500 Index


TSE Composite


| Sponsored By... |

|


