Stock Market Outlook for December 22, 2022

Real Time Economic Calendar provided by Investing.com.
*** Stocks highlighted are for information purposes only and should not be considered as advice to purchase or to sell mentioned securities. As always, the use of technical and fundamental analysis is encouraged in order to fine tune entry and exit points to average seasonal trends.
Stocks Entering Period of Seasonal Strength Today:
Subscribers – Click on the relevant link to view the full profile. Not a subscriber? Signup here.
SPDR S&P Emerging Markets ETF (AMEX:SPEM) Seasonal Chart

Nuveen Real Estate Fund (NYSE:JRS) Seasonal Chart

Japan Equity Fund, Inc. (NYSE:JEQ) Seasonal Chart

Western Asset High Income Opportunity Fund Inc. (NYSE:HIO) Seasonal Chart

First Trust ISE ChIndia Index Fund (NYSE:FNI) Seasonal Chart

iShares Canadian Government Bond Index ETF (TSE:XGB.TO) Seasonal Chart

iShares Canadian Corporate Bond Index ETF (TSE:XCB.TO) Seasonal Chart

Mag Silver Corp. (TSE:MAG.TO) Seasonal Chart

Dream Office Real Estate Investment Trust (TSE:D/UN.TO) Seasonal Chart

iShares S&P/TSX Capped Energy Index ETF (TSE:XEG.to) Seasonal Chart
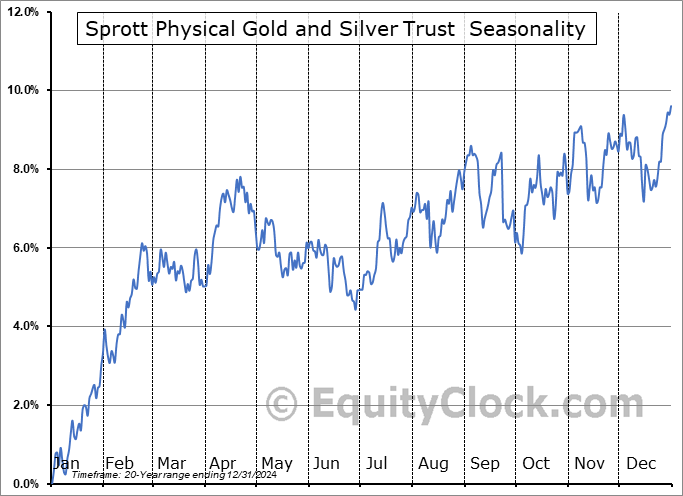
Sprott Physical Gold and Silver Trust (AMEX:CEF) Seasonal Chart
The Markets
Stocks rallied on Wednesday as the selling pressures attributed to the tax loss selling/portfolio rebalancing period alleviate and the Santa Claus rally period gets underway now that traders are starting to step away from their desks for the end of year holidays. The S&P 500 Index closed higher by 1.49%, recovering from short-term oversold territory and moving back to levels around the recently broken 50-day moving average. Minor resistance is directly overhead around 3900 with the more formidable threat presented by declining trendline resistance around 4050. November’s upside gap between 3770 and 3860 continues to be viewed as the logical zone to support to the Santa Claus rally period that is now showing signs of getting underway. The positive trajectory attributed to this year-end phenomenon typically runs through the first few days of the new year, providing relief to the negativity that is normal through the first half of the month. The fundamentals and the technicals to this market continue to appear threatening, but there is still no reason, as of of present, to suggest that this end-of year gyration will not play out.
Sentiment on Wednesday, as gauged by the put-call ratio, ended extremely bearish at 1.67.Today, in our Market Outlook to subscribers, we discuss the following:
Subscribers can look for this report in their inbox or by clicking on the following link and logging in: Market Outlook for December 22 Not signed up yet? Subscribe now to receive full access to all of the research and analysis that we publish.
- The leadership group that is emerging for the Santa Claus rally period and how we are positioning for it
- Another prediction of what to expect of the market in 2023
- US Existing Home Sales
- Canada Consumer Price Index (CPI)
- Investor Sentiment
 Seasonal charts of companies reporting earnings today:


S&P 500 Index


TSE Composite


| Sponsored By... |

|


