Stock Market Outlook for December 21, 2022

Real Time Economic Calendar provided by Investing.com.
*** Stocks highlighted are for information purposes only and should not be considered as advice to purchase or to sell mentioned securities. As always, the use of technical and fundamental analysis is encouraged in order to fine tune entry and exit points to average seasonal trends.
Stocks Entering Period of Seasonal Strength Today:
Subscribers – Click on the relevant link to view the full profile. Not a subscriber? Signup here.
iShares MSCI Japan ETF (NYSE:EWJ) Seasonal Chart

iShares MSCI Malaysia ETF (NYSE:EWM) Seasonal Chart
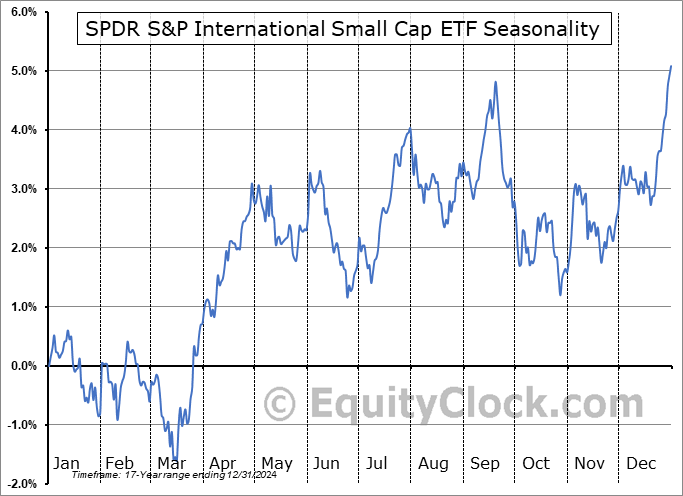
SPDR S&P International Small Cap ETF (NYSE:GWX) Seasonal Chart

Nuveen Municipal High Income Opportunity Fund (NYSE:NMZ) Seasonal Chart

Invesco FTSE RAFI US 1000 ETF (NYSE:PRF) Seasonal Chart

Invesco Trust for Investment Grade Municipals (NYSE:VGM) Seasonal Chart

GoldMining, Inc. (NYSE:GLDG) Seasonal Chart

Suncor Energy, Inc. (NYSE:SU) Seasonal Chart

Sunoco LP (NYSE:SUN) Seasonal Chart

Transcontinental Inc. (TSE:TCL/A.TO) Seasonal Chart

North American Construction Group Ltd (TSE:NOA.TO) Seasonal Chart
The Markets
Stocks edged higher on Tuesday as a reprieve in selling pressures provided hints that the negativity surrounding the front half of December tax-loss selling/portfolio rebalancing period has come to an end. The S&P 500 Index closed with a minor gain of one tenth of one percent, charting a rather indecisive doji candlestick as the benchmark struggles to overcome short-term oversold territory. The benchmark remains in the span of the upside open gap between 3770 and 3860 that was charted early in November, a zone that continues to be looked upon as logical support for the Santa Claus rally period that is now upon us. The more intermediate trend of the market remains that of lower-lows and lower-highs, capped by declining trendline resistance just above 4000, while a minor point of resistance can be pegged around 3900.
Sentiment on Tuesday, as gauged by the put-call ratio, ended close to neutral at 0.92.Today, in our Market Outlook to subscribers, we discuss the following:
Subscribers can look for this report in their inbox or by clicking on the following link and logging in: Market Outlook for December 21 Not signed up yet? Subscribe now to receive full access to all of the research and analysis that we publish.
- Our base case for the performance of stocks in the year ahead
- US Housing Starts
- Canada Retail Sales
 Seasonal charts of companies reporting earnings today:


 Seasonal Chart")


S&P 500 Index


TSE Composite


| Sponsored By... |

|


