Stock Market Outlook for December 16, 2022

Real Time Economic Calendar provided by Investing.com.
*** Stocks highlighted are for information purposes only and should not be considered as advice to purchase or to sell mentioned securities. As always, the use of technical and fundamental analysis is encouraged in order to fine tune entry and exit points to average seasonal trends.
Stocks Entering Period of Seasonal Strength Today:
Subscribers – Click on the relevant link to view the full profile. Not a subscriber? Signup here.
PIMCO High Income Fund (NYSE:PHK) Seasonal Chart

Vanguard Emerging Markets Government Bond ETF (NASD:VWOB) Seasonal Chart

ROBO Global Robotics and Automation Index ETF (AMEX:ROBO) Seasonal Chart

iShares Short Maturity Municipal Bond ETF (AMEX:MEAR) Seasonal Chart

VanEck Vectors Egypt Index ETF (NYSE:EGPT) Seasonal Chart

iShares Edge MSCI Multifactor Canada Index ETF (TSE:XFC.TO) Seasonal Chart

iShares Canadian Value Index ETF (TSE:XCV.TO) Seasonal Chart

Cheniere Energy, Inc. (AMEX:LNG) Seasonal Chart

iShares MSCI ACWI Low Carbon Target ETF (AMEX:CRBN) Seasonal Chart

Lithium Americas Corp. (TSE:LAC.TO) Seasonal Chart

Lennox Intl Inc. (NYSE:LII) Seasonal Chart

Royal Bank of Canada (TSE:RY.TO) Seasonal Chart

Lockheed Martin Corp. (NYSE:LMT) Seasonal Chart

BMO S&P/TSX Equal Weight Global Gold Index ETF (TSE:ZGD.TO) Seasonal Chart

iShares MSCI Sweden ETF (NYSE:EWD) Seasonal Chart
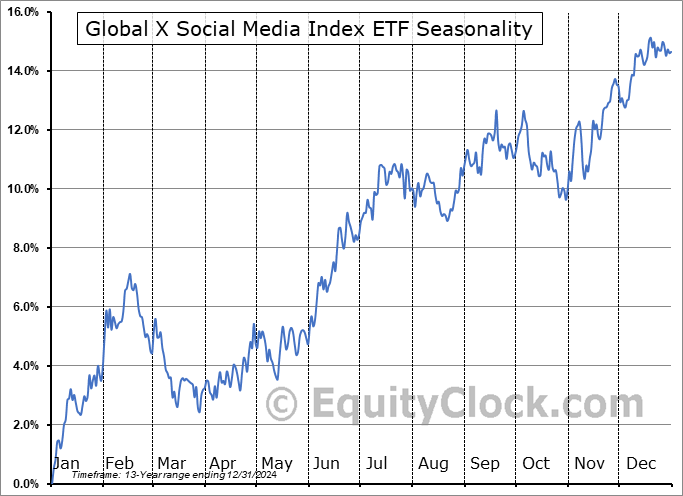
Global X Social Media Index ETF (NASD:SOCL) Seasonal Chart

United States Oil Fund, LP (NYSE:USO) Seasonal Chart

BHP Group Limited (NYSE:BHP) Seasonal Chart

Paramount Resources Ltd. (TSE:POU.TO) Seasonal Chart
The Markets
Stocks dipped on Thursday as a slate of downbeat economic reports forced investors to hit the sell button. The S&P 500 Index plunged by 2.49%, showing ongoing negative reaction to declining trendline resistance overhead, now hovering around 4050. Horizontal support at 3900 was tested and slightly breached around the lows of the day, but the break of this pivotal point of horizontal support was by no means conclusive. The rising 50-day moving average at 3861 remains in a position of support to the intermediate-term trend, a hurdle that we will be looking towards to provide the footing to the Santa Claus rally that is slated to begin in the days ahead. Remember, the first half of the month is dictated by tax-loss selling/end-of-year portfolio rebalancing, a tendency that we have indicated in recent days as perhaps being more prolonged this year given the significant uncertainty that the market exhibited in recent days amidst the release of the November CPI report and the FOMC announcement. The negative impact from these end of year portfolio transactions could continue into the new week before traders start to step away from their desks for the end of year holidays, resulting in the normal holiday influenced uptick in prices that runs through to the start of the new year. The techicals continue to provide an ominous backdrop going into this traditionally upbeat timeframe ahead, but it is difficult to sustain negative momentum through this upbeat period ahead given that investors will not desire to be offside while enjoying the time off through year end.
Sentiment on Thursday, as gauged by the put-call ratio, ended overly bearish at 1.13.Today, in our Market Outlook for subscribers, we discuss the following:
Subscribers can look for this report in their inbox or by clicking on the following link and logging in: Market Outlook for December 16 Not signed up yet? Subscribe now to receive full access to all of the research and analysis that we publish.
- Major aspects advocating for and against the year-end Santa Claus Rally
- US Retail Sales and the stocks of retailers
- US Industrial Production and the rollover of aerospace/defense stocks
 Seasonal charts of companies reporting earnings today:


S&P 500 Index


TSE Composite


| Sponsored By... |

|


