Stock Market Outlook for December 14, 2022

Real Time Economic Calendar provided by Investing.com.
*** Stocks highlighted are for information purposes only and should not be considered as advice to purchase or to sell mentioned securities. As always, the use of technical and fundamental analysis is encouraged in order to fine tune entry and exit points to average seasonal trends.
Stocks Entering Period of Seasonal Strength Today:
Subscribers – Click on the relevant link to view the full profile. Not a subscriber? Signup here.
Vanguard Mid-Cap ETF (NYSE:VO) Seasonal Chart
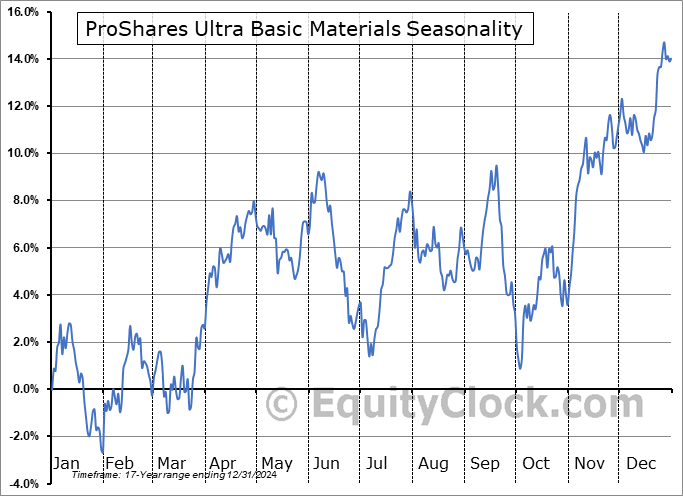
ProShares Ultra Basic Materials (NYSE:UYM) Seasonal Chart

Schwab US Small-Cap ETF (NYSE:SCHA) Seasonal Chart

Oppenheimer Small Cap Revenue ETF (AMEX:RWJ) Seasonal Chart

Invesco DWA Basic Materials Momentum ETF (NASD:PYZ) Seasonal Chart

iShares Russell Mid-Cap ETF (NYSE:IWR) Seasonal Chart

BMO S&P/TSX Equal Weight Global Base Metals Hedged to CAD Index ETF (TSE:ZMT.TO) Seasonal Chart

iShares S&P/TSX 60 Index ETF (TSE:XIU.TO) Seasonal Chart
The Markets
Stocks rallied on Tuesday as a report on consumer prices suggested that inflationary pressures in the economy may be easing. The S&P 500 Index closed with a gain of just less than three-quarters of one percent, retaking levels back above the 20-day moving average that was showing signs of holding back the benchmark in recent days. A jump just after the opening bell had the benchmark briefly surpass declining trendline resistance that presently hovers around 4050, but once investors parsed the details of the CPI report and realized another significant market catalyst will be realized on Wednesday with the FOMC event, investors used the breakout to sell into, instantly pulling it back below the ominous declining hurdle and below its declining 200-day moving average. Horizontal resistance at 4100 has now been confirmed following Tuesday intra-session reversal, a hurdle that can now contend with ongoing horizontal support at 3900. It would be difficult to re-adopt an outright bearish bias of the large-cap benchmark without a break of the aforementioned lower hurdle, just as it would be difficult to become increasingly bullish without a breakout above overhead declining trendline resistance. Eventually, a break of this narrowing range will be realized before the end of the year. Seasonal tendencies give a bias to an upside breakout, while the deterioration in the technicals in the past week have given a downside move a slight edge. The reaction to the Fed event in the day ahead could be the significant catalyst to fuel a breakout or breakdown move before we get into the Santa Clause rally period during the back half of December. Given the uncertainty that has surrounded the two big catalysts this week (CPI and Fed), portfolio managers may need a couple more days to enact year-end portfolio rebalancing trades, therefore we may have to give the start of the Santa Claus rally some leeway, but the probability of success during the timeframe overall is still quite good.
Sentiment on Tuesday, as gauged by the put-call ratio, ended close to neutral at 0.93.Today, in our Market Outlook to subscribers, we discuss the following:
Subscribers can look for this report in their inbox or by clicking on the following link and logging in: Market Outlook for December 14 Not signed up yet? Subscribe now to receive full access to all of the research and analysis that we publish.
- US Consumer Price Index
- The trend of shipping volumes in the economy and the bias for transportation stocks through the months ahead
 Seasonal charts of companies reporting earnings today:


S&P 500 Index


TSE Composite


| Sponsored By... |

|


