Stock Market Outlook for December 13, 2022

Real Time Economic Calendar provided by Investing.com.
*** Stocks highlighted are for information purposes only and should not be considered as advice to purchase or to sell mentioned securities. As always, the use of technical and fundamental analysis is encouraged in order to fine tune entry and exit points to average seasonal trends.
Stocks Entering Period of Seasonal Strength Today:
Subscribers – Click on the relevant link to view the full profile. Not a subscriber? Signup here.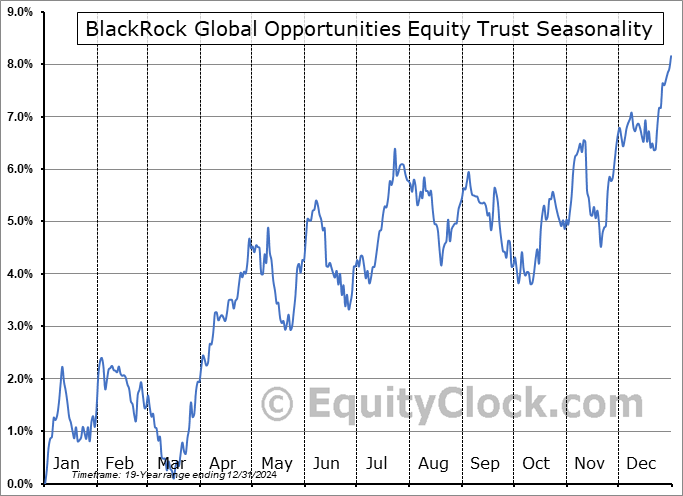
BlackRock Global Opportunities Equity Trust (NYSE:BOE) Seasonal Chart

Eaton Vance Tax-Advantaged Global Dividend Opportunities Fund (NYSE:ETO) Seasonal Chart

iShares MSCI Taiwan ETF (NYSE:EWT) Seasonal Chart

iShares U.S. Oil & Gas Exploration & Production ETF (NYSE:IEO) Seasonal Chart

Vanguard FTSE Canadian Capped REIT Index ETF (TSE:VRE.TO) Seasonal Chart

Comerica, Inc. (NYSE:CMA) Seasonal Chart

Regions Financial Corp. (NYSE:RF) Seasonal Chart

J.B. Hunt Transport Services, Inc. (NASD:JBHT) Seasonal Chart

Canaccord Financial Inc. (TSE:CF.TO) Seasonal Chart
The Markets
Stocks climbed higher on Monday as investors trimmed bearish bets ahead of a couple of important market catalysts that are expected in the days ahead. The S&P 500 Index closed with a gain of 1.43%, closing back at its 20-day moving average that was broken last week. This type of action is all too typical going into an uncertain market event as traders pin price to an important moving average, expressing their neutral bias going into the potential catalyst. The short-term moving average is starting to feel the pull of last week’s breakdown and early signs of rollover is apparent in what could be further proof that the short-term rising trend of stocks has come to an end. Price action continues to narrow between declining trendline resistance around 4050 and horizontal support around 3900. A break, one way or the other, is expected before the end of the year.
Today, in our Market Outlook to subscribers, we discuss the following:
Subscribers can look for this report in their inbox or by clicking on the following link and logging in: Market Outlook for December 13 Not signed up yet? Subscribe now to receive full access to all of the research and analysis that we publish.
- The breakout of the VIX and what it has to suggest pertaining to the short-term path of stocks
- The retracement of treasury yields and the US Dollar Index back to significant support
- Review of the December tendencies/Santa Claus rally period for stocks
- Ratings changes in this week’s chart books: Find out why a negative bias was warranted following last week’s technical degradation
Want to know which areas of the market to buy or sell? Our Weekly Chart Books have just been updated, providing a clear Accumulate, Avoid, or Neutral rating for currencies, cryptocurrencies, commodities, broad markets, and subsectors/industries of the market. Subscribers can login and click on the relevant links to access.Subscribe now.
Sentiment on Monday, as gauged by the put-call ratio, ended bearish at 1.03.


S&P 500 Index


TSE Composite


| Sponsored By... |

|


