Stock Market Outlook for November 30, 2022

Real Time Economic Calendar provided by Investing.com.
*** Stocks highlighted are for information purposes only and should not be considered as advice to purchase or to sell mentioned securities. As always, the use of technical and fundamental analysis is encouraged in order to fine tune entry and exit points to average seasonal trends.
Stocks Entering Period of Seasonal Strength Today:
Subscribers – Click on the relevant link to view the full profile. Not a subscriber? Signup here.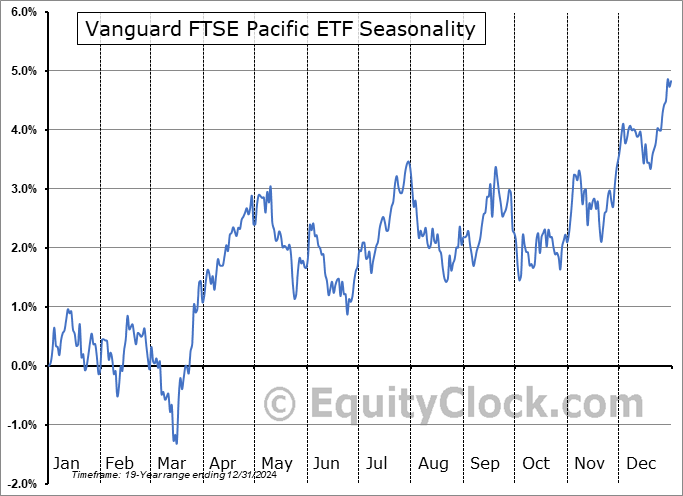
Vanguard FTSE Pacific ETF (NYSE:VPL) Seasonal Chart

iShares MSCI Global Silver Miners ETF (AMEX:SLVP) Seasonal Chart

iShares Silver Trust (NYSE:SLV) Seasonal Chart

SPDR MSCI EAFE Quality Mix ETF (AMEX:QEFA) Seasonal Chart

iShares MSCI Europe Small-Cap ETF (NASD:IEUS) Seasonal Chart

Cambria Global Value ETF (AMEX:GVAL) Seasonal Chart

iShares Core US Treasury Bond ETF (AMEX:GOVT) Seasonal Chart

SPDR DoubleLine Total Return Tactical ETF (AMEX:TOTL) Seasonal Chart

Invesco S&P International Developed Momentum ETF (AMEX:IDMO) Seasonal Chart

iShares MSCI Frontier 100 ETF (AMEX:FM) Seasonal Chart

Magna Intl, Inc. (TSE:MG.TO) Seasonal Chart

Rayonier, Inc. (NYSE:RYN) Seasonal Chart

iShares MSCI Europe Financials ETF (NASD:EUFN) Seasonal Chart

Micron Technology, Inc. (NASD:MU) Seasonal Chart
The Markets
Stocks closed mixed on Tuesday as investors wait for important economic datapoints on the labor market in the days ahead, as well as comments from Fed Chair Jerome Powell on Wednesday. The S&P 500 Index slipped by just less than two-tenths of one percent, peeling back to a confluence of major moving averages that had been broken in recent weeks. The declining 200-day moving average around 4050 remains the significant threat overhead, creating caution amongst market participants that remain cognizant of the long-term negative path of the benchmark. There is a good probability that the short-term rising trend stemming from the October low is maturing, but a number of short-term setups remain favourable to support the large-cap benchmark into year end, including a bull flag pattern. Horizontal support at 3900 remains an important pivot point, above which optimism is warranted that some of these positive short term setups will be fulfilled during what is another period of strength for stocks through the end of December.
Today, in our Market Outlook to subscribers, we discuss the following:
Subscribers can look for this report in their inbox or by clicking on the following link and logging in: Market Outlook for November 30 Not signed up yet? Subscribe now to receive full access to all of the research and analysis that we publish.
- Treasury yields testing rising trendline support
- Bear-flag pattern on the chart of the US Dollar Index heading into a seasonally weak month for the currency benchmark in December
- US Home Prices
- Canada Monthly Gross Domestic Product (GDP)
Sentiment on Tuesday, as gauged by the put-call ratio, ended bearish at 1.04.Just released…
Our monthly report for December is out, providing you with all of the insight that you require to navigate the month ahead and also to set you up for what could be another tough year for stocks in 2023. Highlights in this report include:Subscribers can look for this report in their inbox. Not subscribed yet? Signup now to receive this and all of the content that we publish.
- Equity market tendencies in the month of December
- Volatility coming down, conducive to maintaining the rising short-term trend of stocks
- Declining path of high yield spreads
- Pre-Election Year Tendencies for Stocks under a split congress
- Average performance of stocks during recessionary years
- Using the path of the market during the 1981/82 recession as a guide for stocks moving forward
- Average performance of Gold during recessionary years
- Inverted Yield Curve Nothing to Fear, Yet
- Breakdown in yields/breakout in bond prices
- Inflationary pressures showing no significant signs of alleviating
- Retail sales suggest that sales of discretionary goods are falling off as sales of necessities remain strong
- Housing market is still crumbling, but reason to be constructive of the stocks may still exist
- Time to rotate to Canadian equities?
- US Dollar
- Market Breadth
- Technology burden on the market
- Countries less exposed to technology breaking out
- Our list of Industries noted with an Accumulate rating in our weekly chart books, along with relevant ETFs
- Positioning for the months ahead
- Sector Reviews and Ratings
- Stocks that have Frequently Gained in the Month of December
- Notable Stocks and ETFs Entering their Period of Strength in December
 Seasonal charts of companies reporting earnings today:


S&P 500 Index


TSE Composite


| Sponsored By... |

|


