Stock Market Outlook for November 28, 2022

Real Time Economic Calendar provided by Investing.com.
*** Stocks highlighted are for information purposes only and should not be considered as advice to purchase or to sell mentioned securities. As always, the use of technical and fundamental analysis is encouraged in order to fine tune entry and exit points to average seasonal trends.
Stocks Entering Period of Seasonal Strength Today:
Subscribers – Click on the relevant link to view the full profile. Not a subscriber? Signup here.
Global X Uranium ETF (NYSE:URA) Seasonal Chart

Performance Food Group Co. (NYSE:PFGC) Seasonal Chart

Trican Well Service Ltd. (TSE:TCW.TO) Seasonal Chart

Osisko Mining Inc. (TSE:OSK.TO) Seasonal Chart
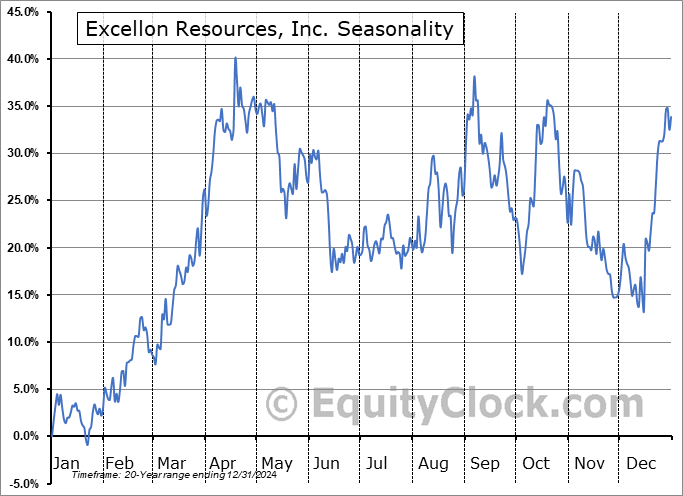
Excellon Resources, Inc. (TSE:EXN.TO) Seasonal Chart

Moody’s Corp. (NYSE:MCO) Seasonal Chart

BMO Floating Rate High Yield ETF (TSE:ZFH.TO) Seasonal Chart

Invesco MSCI Global Timber ETF (NYSE:CUT) Seasonal Chart

SPDR S&P Emerging Markets Small Cap ETF (NYSE:EWX) Seasonal Chart

SPDR S&P Global Natural Resources ETF (NYSE:GNR) Seasonal Chart

ProShares UltraShort Bloomberg Natural Gas (NYSE:KOLD) Seasonal Chart

Global X Silver Miners ETF (NYSE:SIL) Seasonal Chart

VanEck Vectors Steel ETF (NYSE:SLX) Seasonal Chart

Cambria Global Tail Risk ETF (AMEX:FAIL) Seasonal Chart

Oracle Corp. (NYSE:ORCL) Seasonal Chart

Rio Tinto PLC (NYSE:RIO) Seasonal Chart

B2Gold Corp. (TSE:BTO.TO) Seasonal Chart

McEwen Mining Inc. (TSE:MUX.TO) Seasonal Chart

Continental Resources Inc. (NYSE:CLR) Seasonal Chart

APA Corporation (NASD:APA) Seasonal Chart
The Markets
Stocks closed mixed in the holiday shortened Friday session as traders showed no desire to move the tape in any significant manner. The S&P 500 Index closed lower by a mere point (0.03%), trading within a very narrow range just below the declining 200-day moving average. While the short-term trend is still deemed to be positive, supported by the rising 20-day moving average, a minor point of resistance can be picked out at 4030, a high that was initially charted seven session’s ago on November 15th. Hesitation around long-term resistance at the 200-day moving average is implied, suggesting that the benchmark may need a catalyst to move definitively higher above this hurdle in the near-term. A bull-flag and a cup-and-handle pattern on the chart continues to point to an upside objective of 4200, which, if achieved, would see the violation of both the declining 200-day moving average, as well as declining trendline resistance at 4100. Momentum indicators continue to trend higher, relinquishing the characteristics of a bearish trend that have dominated all year.
Sentiment on Friday, as gauged by the put-call ratio, ended close to neutral at 0.93.Today, in our Market Outlook to subscribers, we discuss the following:
Subscribers can look for this report in their inbox or by clicking on the following link and logging in: Market Outlook for November 28 Not signed up yet? Subscribe now to receive full access to all of the research and analysis that we publish.
- Weekly look at the large-cap benchmark
- Stocks increasingly moving and sustaining levels above 200-day moving averages
- Hedge funds are remaining net short this market, despite the rally
- US Petroleum Status and the upcoming seasonal trade in Oil and the Energy sector
 Seasonal charts of companies reporting earnings today:


S&P 500 Index


TSE Composite


| Sponsored By... |

|


