Stock Market Outlook for November 14, 2022

Real Time Economic Calendar provided by Investing.com.
*** Stocks highlighted are for information purposes only and should not be considered as advice to purchase or to sell mentioned securities. As always, the use of technical and fundamental analysis is encouraged in order to fine tune entry and exit points to average seasonal trends.
Stocks Entering Period of Seasonal Strength Today:
Subscribers – Click on the relevant link to view the full profile. Not a subscriber? Signup here.
SPDR S&P Emerging Markets Dividend ETF (NYSE:EDIV) Seasonal Chart

First Trust US IPO Index Fund (NYSE:FPX) Seasonal Chart

First Trust Materials AlphaDEX Fund (NYSE:FXZ) Seasonal Chart

iShares FactorSelect MSCI International ETF (AMEX:INTF) Seasonal Chart

SPDR S&P Global Dividend ETF (AMEX:WDIV) Seasonal Chart

iShares Global Timber & Forestry ETF (NASD:WOOD) Seasonal Chart

CMS Energy Corp. (NYSE:CMS) Seasonal Chart
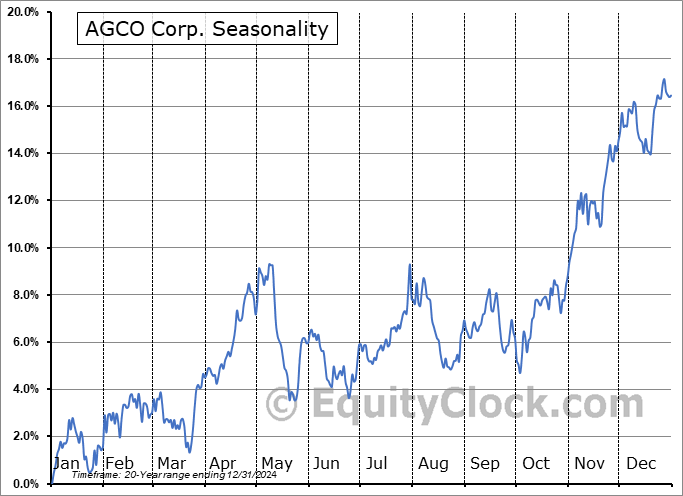
AGCO Corp. (NYSE:AGCO) Seasonal Chart

BorgWarner, Inc. (NYSE:BWA) Seasonal Chart

Bunge Ltd. (NYSE:BG) Seasonal Chart

Barrick Gold Corp. (NYSE:GOLD) Seasonal Chart

iShares U.S. Healthcare ETF (NYSE:IYH) Seasonal Chart

Invesco Global Listed Private Equity ETF (NYSE:PSP) Seasonal Chart

SPDR S&P Internet ETF (AMEX:XWEB) Seasonal Chart

Precision Drilling Corp. (TSE:PD.TO) Seasonal Chart
The Markets
Stocks followed through with Thursday’s strong rally to close the week higher as investors race to cover negative bets that had become elevated through recent months and recent days. The S&P 500 Index realized a gain of just less than one percent, continuing to make progress above horizontal resistance around 3900 and seemingly on track to test the declining 200-day moving average in the days/weeks ahead. The 20-day moving average has crossed back above its 50-day moving average, a positive technical event that was last seen at the start of August amidst the summer rally in stocks. The benchmark is back on a short-term rising trend, supported by levels around its rising 20-day moving average, and the revelation of a cup-and-handle pattern between 3600 and 3900 projects an upside target towards 4200. The 50-day moving average is starting to feel the levitation from this weeks breakout and is showing very early signs of bottoming. This intermediate hurdle is highly important to our seasonal strategy and when it is on the rise, typically a positive bias of stocks is warranted and using the hurdle as a level of support to buy is typically prudent. In addition to the declining 200-day moving average as a level of near-term resistance, traders should be cognizant of the downside gap that was charted in September around 4050 as a potential point to lead to a pause in the recent positivity in the equity benchmark, but, overall, the trend remains conducive to the ongoing strength of prices through the end of the year.
Sentiment on Friday, as gauged by the put-call ratio, ended bullish at 0.75.Today, in our Market Outlook to subscribers, we discuss the following:
Subscribers can look for this report in their inbox or by clicking on the following link and logging in: Market Outlook for November 14 Not signed up yet? Subscribe now to receive full access to all of the research and analysis that we publish.
- The bottoming pattern in the Technology sector and when to seek to become sellers of exposure
- Lack of buying conviction to Thursday’s equity market rally
- A look at the average performance of the S&P 500 Index during recessionary years
- Investor Sentiment
 Seasonal charts of companies reporting earnings today:


S&P 500 Index


TSE Composite


| Sponsored By... |

|


