Stock Market Outlook for November 11, 2022

Real Time Economic Calendar provided by Investing.com.
*** Stocks highlighted are for information purposes only and should not be considered as advice to purchase or to sell mentioned securities. As always, the use of technical and fundamental analysis is encouraged in order to fine tune entry and exit points to average seasonal trends.
Stocks Entering Period of Seasonal Strength Today:
Subscribers – Click on the relevant link to view the full profile. Not a subscriber? Signup here.
Invesco S&P 500 Equal Weight Health Care ETF (NYSE:RYH) Seasonal Chart

iShares MSCI India ETF (AMEX:INDA) Seasonal Chart
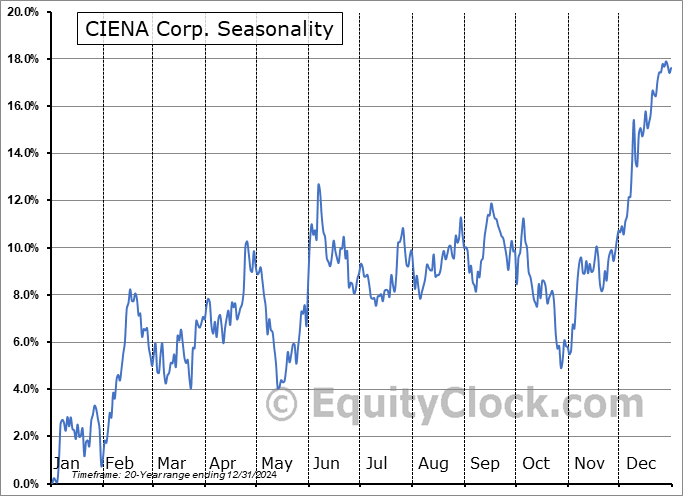
CIENA Corp. (NYSE:CIEN) Seasonal Chart

Riocan Real Estate Investment Trust (TSE:REI/UN.TO) Seasonal Chart

Northland Power Inc. (TSE:NPI.TO) Seasonal Chart

Church & Dwight Co, Inc. (NYSE:CHD) Seasonal Chart

Andersons, Inc. (NASD:ANDE) Seasonal Chart

Toyota Motor Corp. (NYSE:TM) Seasonal Chart
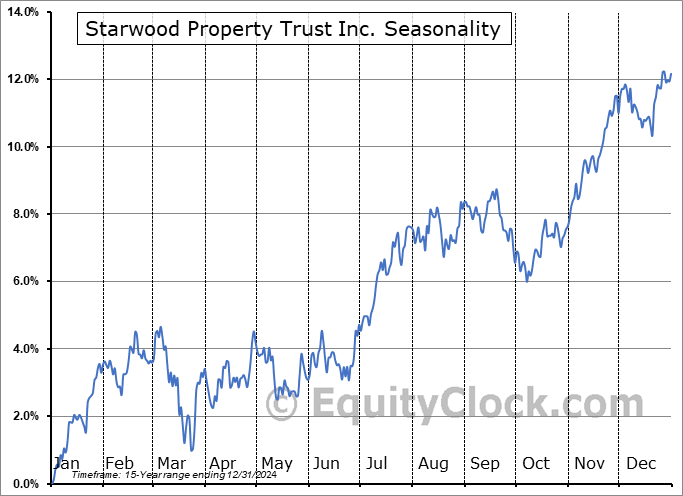
Starwood Property Trust Inc. (NYSE:STWD) Seasonal Chart

Taiwan Semiconductor Mfg (NYSE:TSM) Seasonal Chart
The Markets
Nothing like a good old-fashioned whipsaw to keep us on our toes. Stocks surged on Thursday as a weaker than expected increase in consumer prices for October unleashed a wave of short covering. The S&P 500 Index rallied by 5.54%, achieving the best single session daily return since April of 2020 as the market was rebounding from the pandemic lows. Instantly, declining short-term resistance that had been highlighted in recent days at 3850 has been shattered and levels above the 50-day moving average retaken. The higher short-term low above the October bottom and the move above the end of October high on the benchmark sets up a cup-and-handle pattern that projects an upside target towards 4200, which would obviously be an impressive outcome if achieved. Declining trendline resistance and the 200-day moving average around 4100 may stand in the way. Momentum indicators remain within rising trends stemming from the September lows and have started to curl back higher follow the recent rollover that threatened an imminent sell signal with respect to MACD. Thursday’s gap open between 3770 and 3860 creates a massive zone to shoot off of on the long side as the market seeks to move past some of the threats that were seen just a day ago.
Sentiment on Thursday, as gauged by the put-call ratio, ended bullish at 0.84.Today, in our Market Outlook to subscribers, we discuss the following:
Subscribers can look for this report in their inbox or by clicking on the following link and logging in: Market Outlook for November 11 Not signed up yet? Subscribe now to receive full access to all of the research and analysis that we publish.
- The shift of trend in the bond market
- Continuing to monitor the breakdown in the cryptocurrency market
- Looking at our bond market exposure in the Super Simple Seasonal Portfolio
- US Consumer Price Index
- Weekly Jobless Claims and the health of the labor market
 Seasonal charts of companies reporting earnings today:


S&P 500 Index


TSE Composite


| Sponsored By... |

|


