Stock Market Outlook for November 9, 2022

Real Time Economic Calendar provided by Investing.com.
*** Stocks highlighted are for information purposes only and should not be considered as advice to purchase or to sell mentioned securities. As always, the use of technical and fundamental analysis is encouraged in order to fine tune entry and exit points to average seasonal trends.
Stocks Entering Period of Seasonal Strength Today:
Subscribers – Click on the relevant link to view the full profile. Not a subscriber? Signup here.
Vanguard S&P 500 Index ETF (TSE:VFV.TO) Seasonal Chart

iShares Core S&P Total US Stock Market ETF (NYSE:ITOT) Seasonal Chart

iShares Core US Value ETF (NASD:IUSV) Seasonal Chart

Invesco S&P SmallCap Momentum ETF (AMEX:XSMO) Seasonal Chart

Badger Infrastructure Solutions Ltd. (TSE:BDGI.TO) Seasonal Chart
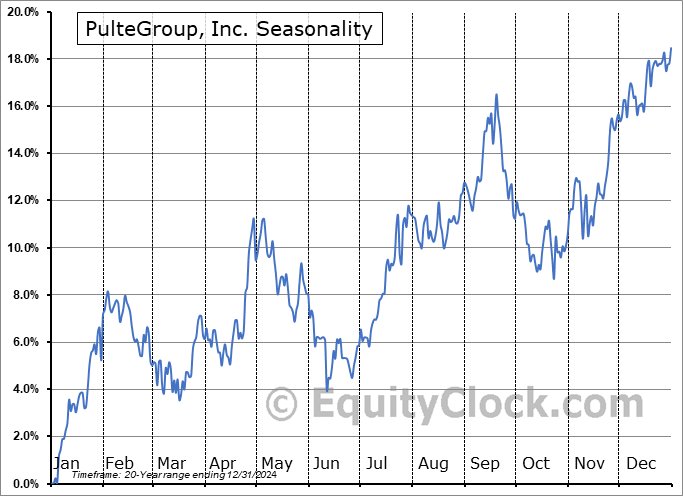
PulteGroup, Inc. (NYSE:PHM) Seasonal Chart

The J. M. Smucker Co. (NYSE:SJM) Seasonal Chart

Helen of Troy Ltd. (NASD:HELE) Seasonal Chart

Lowes Companies, Inc. (NYSE:LOW) Seasonal Chart
The Markets
Stocks elevated into Tuesday’s close as market participants show a bias towards Republican wins when the votes are tallied in the mid-term election. The S&P 500 Index closed with a gain of just less than six-tenths of one percent, charting a rather indecisive doji candlestick pattern above its declining 50-day moving average. Short-term support remains intact around the rising 20-day moving average, a pivotal level to start to define the shift of the intermediate declining path of the market. The benchmark continues to hold a range of support between 3600 and 3800, providing the base for the potential end of year strength for the market that is normal. The trend of momentum indicators since the oversold lows in September remainss higher, although MACD is still bordering on a sell signal as the indicator converges on its signal line.
Sentiment on Tuesday, as gauged by the put-call ratio, ended bearish at 1.16.Today, in our Market Outlook to subscribers, we discuss the following:
Subscribers can look for this report in their inbox or by clicking on the following link and logging in: Market Outlook for November 9 Not signed up yet? Subscribe now to receive full access to all of the research and analysis that we publish.
- Short-term declining trendline resistance on the hourly chart of the large-cap benchmark and mid-term election year tendencies for stocks
- MSCI World ex US Index
- Breakout above negative trendline resistance for many country ETFs
- The abrupt downdraft in cryptocurrencies on Tuesday
 Seasonal charts of companies reporting earnings today:


 Seasonal Chart")


S&P 500 Index


TSE Composite


| Sponsored By... |

|


