Stock Market Outlook for November 8, 2022

Dow Jones Industrial Average attempting to push above a cloud of resistance presented by major moving averages during its period of seasonal strength.
*** Stocks highlighted are for information purposes only and should not be considered as advice to purchase or to sell mentioned securities. As always, the use of technical and fundamental analysis is encouraged in order to fine tune entry and exit points to average seasonal trends.
Stocks Entering Period of Seasonal Strength Today:
Subscribers – Click on the relevant link to view the full profile. Not a subscriber? Signup here.

Invesco New York AMT-Free Municipal Bond ETF (NYSE:PZT) Seasonal Chart

Cyanotech Corp. (NASD:CYAN) Seasonal Chart

SPDR S&P Homebuilders ETF (NYSE:XHB) Seasonal Chart

Vanguard Value ETF (NYSE:VTV) Seasonal Chart

Invesco S&P 500 Equal Weight ETF (NYSE:RSP) Seasonal Chart

iShares Mortgage Real Estate Capped ETF (NYSE:REM) Seasonal Chart
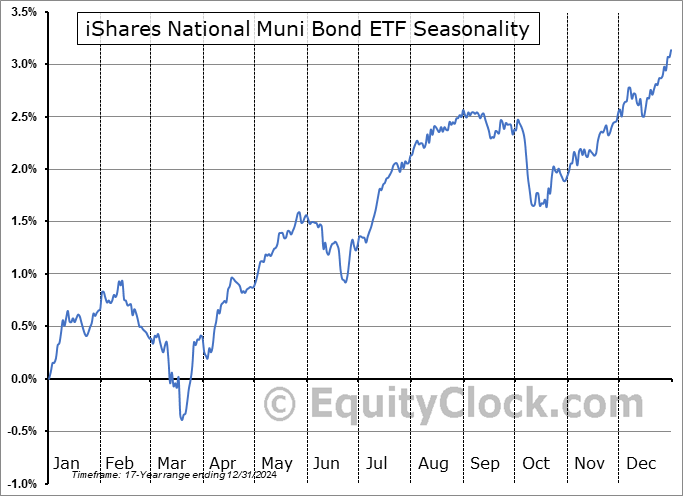
iShares National Muni Bond ETF (NYSE:MUB) Seasonal Chart

iShares S&P Mid-Cap 400 Value ETF (NYSE:IJJ) Seasonal Chart

Monster Beverage Corp. (NASD:MNST) Seasonal Chart
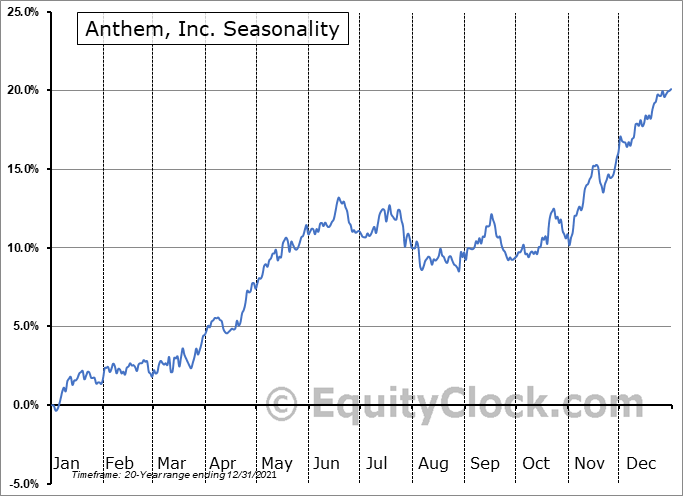
Anthem, Inc. (NYSE:ANTM) Seasonal Chart

Canadian Apartment Properties Real Estate Investment Trust (TSE:CAR/UN.TO) Seasonal Chart

Caterpillar, Inc. (NYSE:CAT) Seasonal Chart
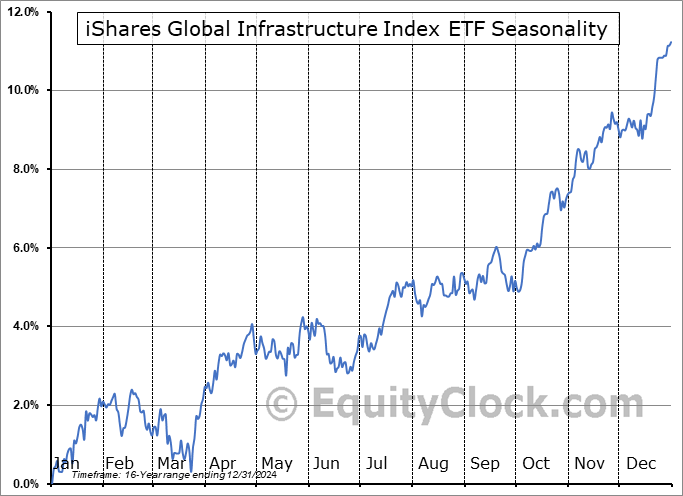
iShares Global Infrastructure Index ETF (TSE:CIF.TO) Seasonal Chart

Abercrombie & Fitch Co. (NYSE:ANF) Seasonal Chart
The Markets
Stocks kicked off the new week with a gain as investors position ahead of the US midterm election on Tuesday and the highly scrutinized inflation report on Thursday. The S&P 500 Index closed with a gain of just less than one percent, continuing to bounce from its rising 20-day moving average and intersecting with its declining 50-day moving average. Momentum indicators continue to show a positive divergences compared to price, although signs of rollover remain with MACD bordering on a sell signal, should it cross below its signal line. A number of points of resistance presented by declining major moving averages persists overhead, threatening to cap any near-term advance, however, seasonality provides the leeway for a positive bias of stocks into year-end. Our focus are on those groups of the market that are identified with an Accumulate rating (list presented to subscribers below) according to our weekly chart books as these are the segments that are and will attract sustained buying demand into year end.

Today, in our Market Outlook to subscribers, we discuss the following:
- Dow Jones Industrial Average
- Ratings changes in this week’s chart books and industries/ETFs on our list of segments of the market to Accumulate
- Copper
- Cryptocurrencies
Subscribers can look for this report in their inbox or by clicking on the following link and logging in: Market Outlook for November 8
Not signed up yet? Subscribe now to receive full access to all of the research and analysis that we publish.
Want to know which areas of the market to buy or sell? Our Weekly Chart Books have just been updated, providing a clear Accumulate, Avoid, or Neutral rating for currencies, cryptocurrencies, commodities, broad markets, and subsectors/industries of the market. Subscribers can login and click on the relevant links to access.
Subscribe now.
Sentiment on Monday, as gauged by the put-call ratio, ended bullish at 0.88.

Seasonal charts of companies reporting earnings today:
 Seasonal Chart")


S&P 500 Index


TSE Composite


| Sponsored By... |

|


