Stock Market Outlook for November 7, 2022

Looking for clues as to how to position in the equity and bond markets following the release of employment reports in the US and Canada.
*** Stocks highlighted are for information purposes only and should not be considered as advice to purchase or to sell mentioned securities. As always, the use of technical and fundamental analysis is encouraged in order to fine tune entry and exit points to average seasonal trends.
Stocks Entering Period of Seasonal Strength Today:
Subscribers – Click on the relevant link to view the full profile. Not a subscriber? Signup here.

Invesco S&P 500 Equal Weight Financials ETF (NYSE:RYF) Seasonal Chart

Enghouse Systems Ltd. (TSE:ENGH.TO) Seasonal Chart

Health Care Select Sector SPDR Fund (NYSE:XLV) Seasonal Chart

First Asset Active Utility & Infrastructure ETF (TSE:FAI.TO) Seasonal Chart

TransAlta Corp. (TSE:TA.TO) Seasonal Chart

Cogeco Cable, Inc. (TSE:CCA.TO) Seasonal Chart

Masco Corp. (NYSE:MAS) Seasonal Chart

Ag Growth International Inc. (TSE:AFN.TO) Seasonal Chart
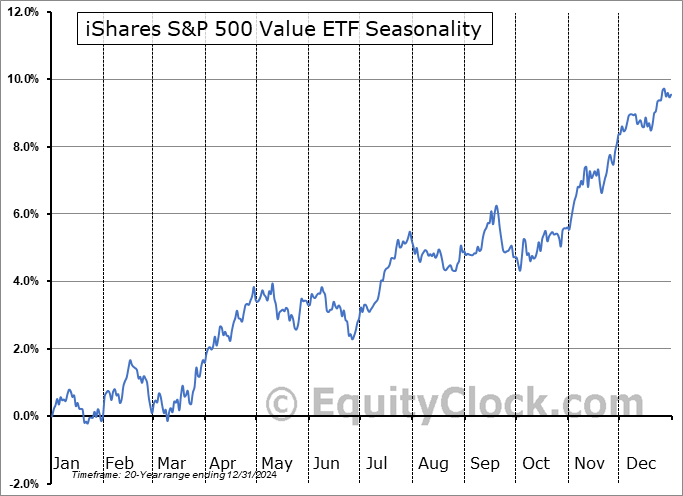
iShares S&P 500 Value ETF (NYSE:IVE) Seasonal Chart

iShares Russell 1000 Value ETF (NYSE:IWD) Seasonal Chart

Vanguard Small-Cap Value ETF (NYSE:VBR) Seasonal Chart

SPDR S&P Telecom ETF (NYSE:XTL) Seasonal Chart

Louisiana Pacific Corp. (NYSE:LPX) Seasonal Chart
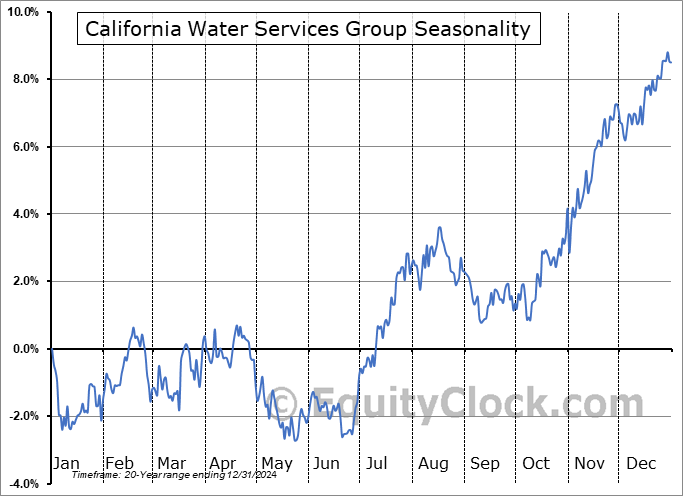
California Water Services Group (NYSE:CWT) Seasonal Chart

Jazz Pharmaceuticals, Inc. (NASD:JAZZ) Seasonal Chart

TreeHouse Foods Inc. (NYSE:THS) Seasonal Chart

Xylem Inc. (NYSE:XYL) Seasonal Chart

iShares U.S. Small Cap Index ETF (CAD-Hedged) (TSE:XSU.TO) Seasonal Chart
The Markets
Stocks closed strongly higher on Friday, shaking off jitters that materialized intraday pertaining to the risks that the Fed would maintain its aggressive tightening path for longer following a very strong payroll report for October. The S&P 500 Index gained by 1.36%, bouncing from support around its rising 20-day moving average at 3735. The declining 50-day moving average is in a position of resistance around 3800, a level that was tested around the highs of the session before prices pulled back through the middle of the day. The candlestick pattern over the past two sessions, following the Fed announcement, has been highly indecisive around short-term support at the 20-day moving average, highlighting that investors are not quite sure which direction to push stocks as we prepare for the mid-term election on Tuesday. The bias of the market is that Republicans will take control of the House of Representatives and possibly the Senate, a bias that has helped to support stocks in recent weeks given the more business friendly policies that the Republican party typically implements. According to the average pattern during mid-term election years, stocks tend to drift sideways following the election, through the middle of November, before turning higher again around month-end as the jovial sentiment that materializes around the US Thanksgiving holiday lifts stocks. Momentum indicators on the daily chart have rolled over, but they have yet to trigger a sell signal following October’s rally. The potential of a bottoming pattern lending itself to the normal year-end rally for stocks remains intact.

Today, in our Market Outlook to subscribers, we discuss the following:
- Weekly look at the large-cap benchmark
- Stock over bond ratio and what has been priced into this market
- A shift of market sentiment since the end of the third quarter
- US Employment Situation and the rapid ascent of wages
- Canada Labour Force Survey
Subscribers can look for this report in their inbox or by clicking on the following link and logging in: Market Outlook for November 7
Not signed up yet? Subscribe now to receive full access to all of the research and analysis that we publish.
Sentiment on Friday, as gauged by the put-call ratio, ended bearish at 1.02.

Seasonal charts of companies reporting earnings today:


 Seasonal Chart")


S&P 500 Index


TSE Composite


| Sponsored By... |

|


